| Journal of Medical Cases, ISSN 1923-4155 print, 1923-4163 online, Open Access |
| Article copyright, the authors; Journal compilation copyright, J Med Cases and Elmer Press Inc |
| Journal website https://jmc.elmerpub.com |
Case Report
Volume 17, Number 12, December 2026, pages 733-744

Twenty-Three Years of Survival Observed in a Diabetic Woman Receiving Extended-Hours Hemodialysis (18–25 Hours per Week) With a Liberalized Diet
Fumika Kanedaa, Toshiro Nishiyamab, d, Kazunori Owadaa, Koichi Katayosea, Katsuhiko Suzukic, Hiroshi Kanedaa
aDepartment of Nephrology, Kamome Clinic, Iwaki City, Fukushima 972-8301, Japan
bDepartment of Medical Engineering, Kamome Clinic, Iwaki City, Fukushima 972-8301, Japan
cDepartment of Nephrology, Nagoya University Graduate School of Medicine, Nagoya City 466-8550, Japan
dCorresponding Author: Toshiro Nishiyama, Department of Medical Engineering, Kamome Clinic, Iwaki City, Fukushima 972-8301, Japan
Manuscript submitted September 4, 2026, accepted October 7, 2026, published online November 9, 2026
Short title: Prolonged Survival in Patients With Diabetes Undergoing Hemodialysis
doi: https://doi.org/10.14740/jmc5424
| Abstract | ▴Top |
Patients with diabetes undergoing hemodialysis are known to develop numerous complications and have significantly higher mortality risk compared with patients without diabetes. Improving glycemic control is expected to improve the prognosis of patients with diabetes undergoing hemodialysis. However, dietary restrictions imposed for dialysis management and blood glucose control cause malnutrition, leading to an increased risk of protein-energy wasting (PEW), which complicates blood glucose control. Conventional hemodialysis is performed three times a week for 4 h. In contrast, our clinic provides extended-hours hemodialysis with a liberalized diet, 3–4 times a week for 6–8 h, to control hypertension and prevent malnutrition. This report describes a patient who initiated renal replacement therapy (RRT) for diabetic nephropathy and, despite multiple complications after transferring to our clinic, maintained extended-hours hemodialysis with a liberalized diet for 23 years. In this case, monotherapy with α-glucosidase inhibitors maintained glycemic control, with an average glycated albumin level of 18.0±1.7%. After the patient transferred to our clinic, her body mass index (BMI) and muscle mass increased. However, severe vascular calcification was already present shortly after transfer, resulting in two severe diabetic vascular complications caused by vascular calcification: ischemic heart disease and below-knee amputation. BMI temporarily decreased at the time of each event, but subsequently trended upward again. Left ventricular ejection fraction remained within the normal range at 62–72%, and the patient maintained independence in daily life after below-knee amputation, albeit with wheelchair use. The changes in muscle mass and prognosis in this case likely reflect multiple factors, including adequate dialysis dosage and high health literacy, during extended-hours hemodialysis with a liberalized diet. These observations offer insights into diabetic patients on hemodialysis but do not establish causality.
Keywords: Diabetes undergoing hemodialysis; Extended-hours hemodialysis with a liberalized diet; BMI; Muscle mass
| Introduction | ▴Top |
Type 2 diabetes mellitus is the primary cause of end-stage renal disease, known to cause a wide range of complications including cardiovascular disorders, cerebrovascular disorders, infections, and peripheral artery disease [1, 2]. Blood glucose control in patients undergoing hemodialysis is expected to delay the progression of microvascular and macrovascular complications and improve prognosis [3]. On the other hand, dietary restrictions, which are prone to being overly strict, can lead to nutritional deficiencies such as frailty and sarcopenia [4, 5]. Malnutrition increases the risk of infection and inflammation [6]. Additionally, decreased muscle mass reduces insulin sensitivity, complicating blood glucose control [7]. Patients with diabetes undergoing hemodialysis, who often have difficulty controlling their blood pressure, tend to have persistent hypertension, which further accelerates the progression of arteriosclerosis. For these reasons, they have a higher mortality risk compared with hemodialysis patients without diabetes [8, 9]. For 28 years, our clinic has provided a unique dialysis treatment modality called extended-hours hemodialysis with a liberalized diet, aimed at controlling hypertension and malnutrition. This treatment method has three key features. First, our clinic specializes in providing extended-hours hemodialysis. Conventional hemodialysis is performed three times a week for 4 h per session, but at our clinic, patients receive at least 6 h per session, and we recommend even longer hemodialysis of up to 8 h. When clinical symptoms fail to improve, we recommend increasing to frequent extended-hours hemodialysis, performed four times weekly. Second, rather than imposing dietary restrictions, we recommend that patients eat the same diet as healthy family members. Third, extended dialysis duration reduces the ultrafiltration rate (UFR), allowing treatment to be performed at lower blood flow rates. Together, these features enable a slower, more stable hemodialysis treatment compared with conventional dialysis. Here, we report a case of a patient with diabetic nephropathy who initiated renal replacement therapy (RRT) and, despite developing multiple complications, continued extended-hours hemodialysis with a liberalized diet for 23 years.
| Case Report | ▴Top |
An 83-year-old woman developed type 2 diabetes mellitus at age 50 and began treatment with oral antidiabetic drugs. Her kidney function subsequently declined gradually. Seven years after the onset of diabetes mellitus (September 2000), she selected continuous ambulatory peritoneal dialysis (CAPD), a form of RRT, for diabetic nephropathy and began treatment at a general hospital. At the hospital where the therapy was introduced, CAPD was chosen because securing the resources for thrice-weekly hemodialysis visits was difficult. In contrast, CAPD could be managed with only twice-monthly visits. Short-term insulin therapy was then administered for several months to control her blood glucose levels. In April 2002, peritoneal function declined, fluid removal became difficult, and heart failure developed. Consequently, once-weekly hemodialysis was initiated in combination with CAPD. She developed peritonitis, prompting the discontinuation of CAPD and a transition to hemodialysis alone. In July 2003, she then selected our clinic, which offers extended-hours hemodialysis with a liberalized diet, and was transferred to our facility. Before transferring to our clinic, she had been undergoing conventional hemodialysis three times weekly for 4 h per session. After transferring, at her own request, she began extended-hours hemodialysis with a liberalized diet, three times weekly for 6 h per session. In July 2005, the session duration was further extended to 7 h, three times weekly (Fig. 1a). However, although this patient underwent extended-hours hemodialysis with a liberalized diet and was encouraged to eat the same meals as her healthy family members, she did not receive nutritional guidance, and her dietary intake was not quantified. Therefore, it is impossible to demonstrate that this patient maintained an appropriate level of dietary intake.
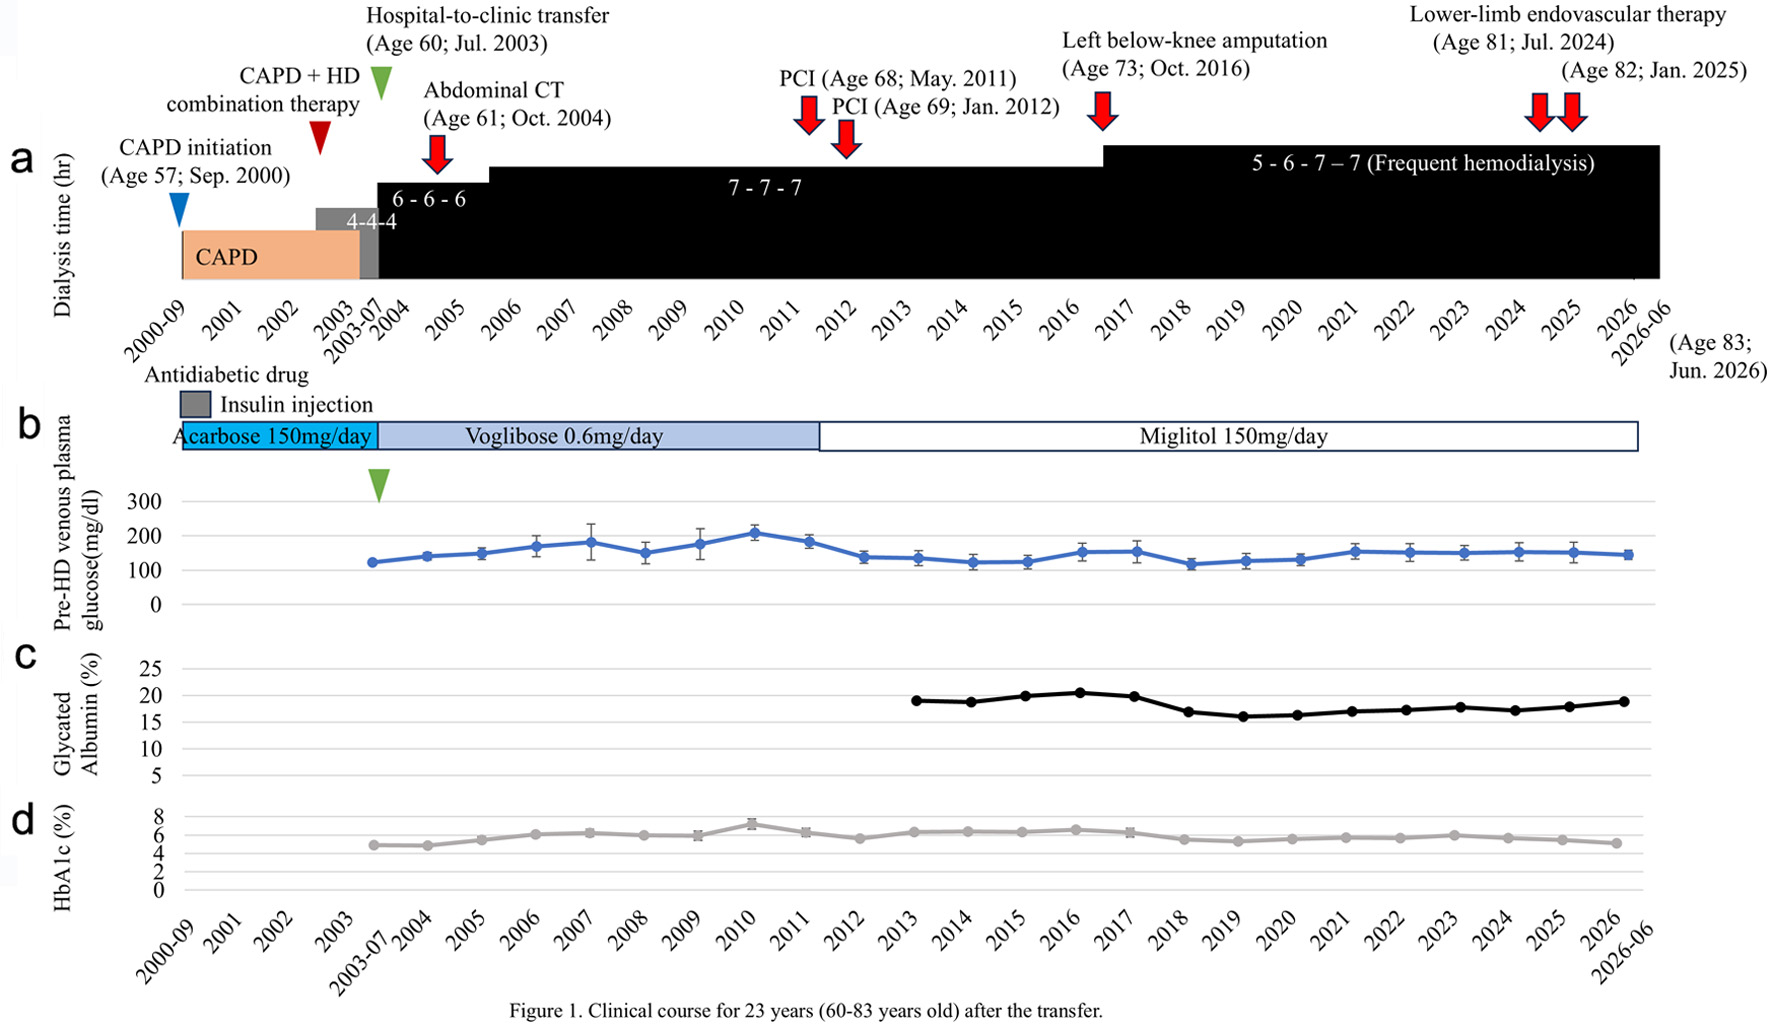 Click for large image | Figure 1. Clinical course over 23 years (60–83 years old) after the transfer. (a) After transfer, the patient initiated extended-hours hemodialysis with a liberalized diet at 6 h per session. The dialysis duration was gradually extended and, triggered by a left below-knee amputation in October 2016, the regimen shifted to frequent, extended-hours hemodialysis four times a week. This extended-hours hemodialysis with a liberalized diet continued for 23 years. (b) Changes in prehemodialysis venous plasma glucose and hypoglycemic medications. (c) Changes in glycated albumin levels. (d) Changes in HbA1c levels. CAPD: continuous ambulatory peritoneal dialysis; CT: computed tomography; GA: glycated albumin; HbA1c: hemoglobin A1c; HD: hemodialysis; PCI: percutaneous coronary intervention. |
Figure 1b shows monthly prehemodialysis venous plasma glucose values measured by automated laboratory analysis, along with changes in glucose-lowering medications. Glycemic control was managed using an α-glucosidase inhibitor (α-GI) as monotherapy. Although acarbose was administered at transfer, the medication was switched to voglibose (0.6 mg/day) because it has a lower incidence of gastrointestinal side effects. In July 2011, the medication was changed to miglitol (150 mg/day)—which suppresses early postprandial blood glucose spikes more effectively than voglibose—because prehemodialysis blood glucose levels over the preceding 12 months had averaged 209 ± 22.3 mg/dL (range: 160–226 mg/dL), hovering at the upper limit of the target range (< 180–200 mg/dL). Following the switch, prehemodialysis blood glucose levels decreased; the mean level over the subsequent 12 months was 138 ± 18.1 mg/dL (range: 110–166 mg/dL). No episodes of hypoglycemia requiring intervention were recorded during the observation period. There were no records of glucose administration during any of the 4,074 dialysis sessions, nor was there any history of prescriptions for glucose for home use. Medical records showed no documentation or treatment of hypoglycemic attacks. The lowest prehemodialysis venous plasma glucose level was 93 mg/dL, and no levels fell below the 70 mg/dL alert threshold. The use of a dialysate with a glucose concentration of 100 mg/dL was consistent with the low risk of hypoglycemia. However, the possibility of mild or asymptomatic hypoglycemia occurring at home cannot be ruled out, as such events were not systematically recorded.
Glycated albumin (GA) levels, measured since 2013, ranged from 16.0–20.5%, generally remaining below the glycemic control target of < 20%. The mean GA value was 18.0±1.7% (Fig. 1c).
After transfer to our clinic, hemoglobin A1c (HbA1c) values ranged from 4.9–7.2% over 23 years, with a mean HbA1c of 6.0±0.6% during this period (Fig. 1d).
The patient had already developed arteriolosclerosis before transfer to our clinic and had undergone photocoagulation for diabetic retinopathy. In October 2004, an abdominal computed tomography screening examination performed at our clinic revealed severe calcification of the abdominal aorta (Fig. 2). In 2006, pharmacological treatment with prostaglandin E1 (by injections and orally) was initiated because of poorly palpable lower-extremity arterial pulses and intermittent claudication, and she actively engaged in exercise therapy. Ankle-brachial index (ABI) testing at that time showed a mild decrease, with values of 0.88 bilaterally. However, in 2010, follow-up ABI testing showed a marked decline, with a right-side value of 0.83 and a left-side value of 0.67, consistent with progression to significant stenosis of the left lower-extremity artery. Contrast-enhanced multidetector computed tomography (MDCT) of the lower extremities revealed severe vascular calcification extending from the abdominal aorta to the bilateral lower-extremity arteries, along with diffuse moderate-to-severe stenosis from the superficial femoral artery to the popliteal artery. Based on these findings, antiplatelet therapy (aspirin) was added. However, in February 2016, an ulcer developed on the left second toe, triggered by interdigital compression. This was accompanied by cyanosis and progressed to refractory left lower-extremity ulcers. Because revascularization was considered difficult due to vascular calcification, she received wound care and observation. However, in October 2016, gangrene progressed, and a left below-knee amputation was performed. Due to inflammation from long-standing lower-extremity ulcers and a 1-month hospitalization following the amputation, she experienced marked weight loss and developed hypertension, for which antihypertensive medication was initiated. At the time of transfer back to our clinic after surgery, hemodialysis therapy was changed at her strong request to frequent extended-hours hemodialysis with a liberalized diet four times a week (5–6–7–7 hours) to control hypertension. Furthermore, in July 2024, she developed an ulcer on the right fifth toe, and contrast-enhanced MDCT of the lower extremities revealed severe stenosis of the right external iliac artery and superficial femoral artery. Revascularization was indicated; a stent was placed from the common iliac artery to the external iliac artery, and drug-coated balloon angioplasty was performed on the superficial femoral artery. In January 2025, balloon angioplasty was repeated, after which the right fifth toe ulcer healed without signs of infection.
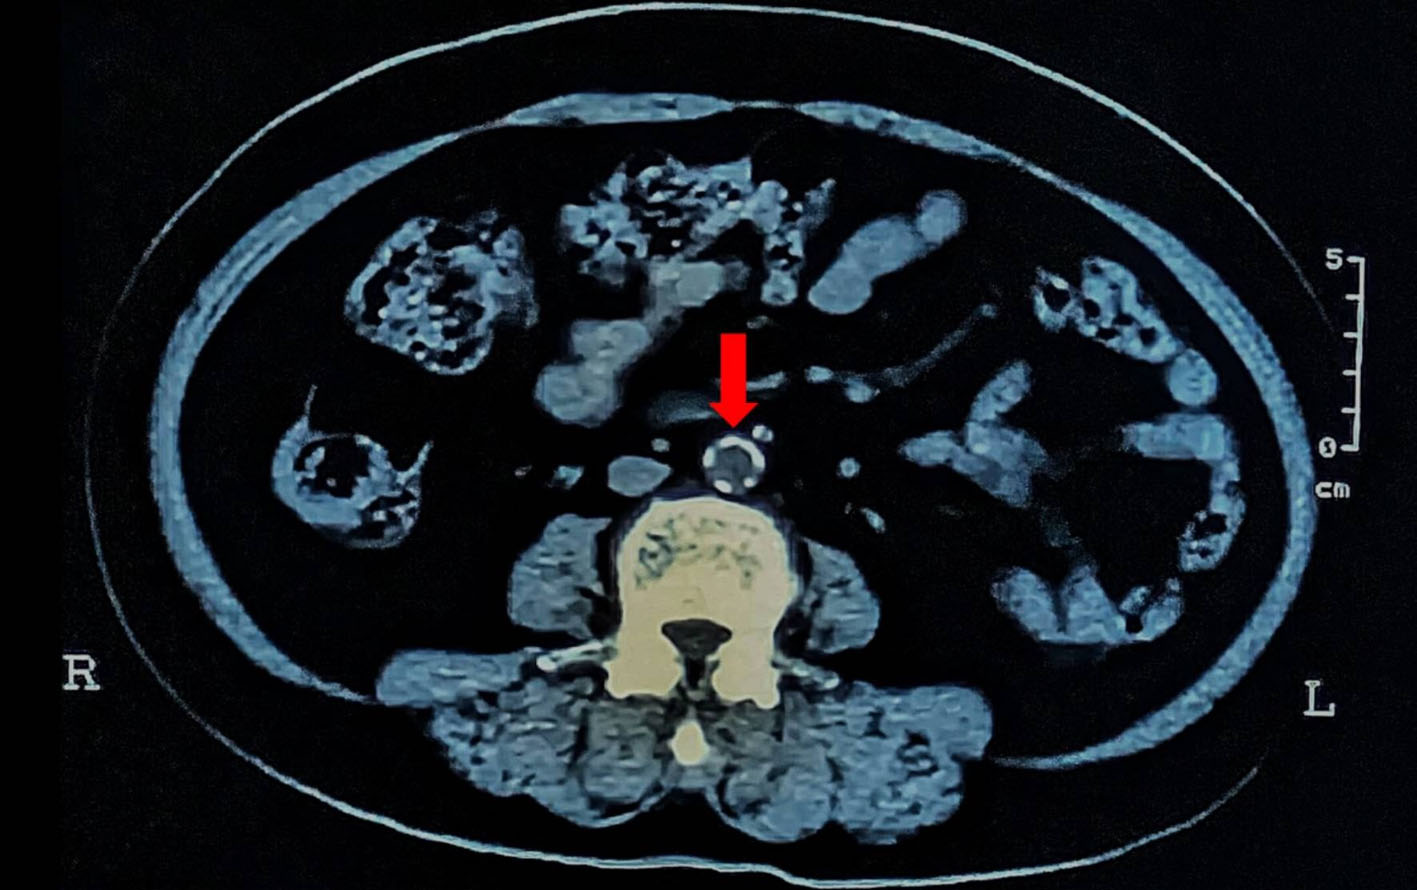 Click for large image | Figure 2. Abdominal aortic CT image 1 year after transfer. One year after transfer (at age 61), severe circumferential vascular calcification is already evident in the abdominal aorta. The red arrow indicates the calcified areas of the abdominal aorta. |
Regarding cardiovascular disease, she presented with chest pain in February 2011. Contrast-enhanced MDCT revealed severe stenosis of the left anterior descending artery due to vascular calcification. Percutaneous coronary intervention (PCI) was performed in May 2011; however, restenosis developed, requiring a second PCI with stent placement at two sites in January 2012. No new coronary artery stenosis has been observed since. Regarding valvular disease, only mild aortic stenosis (AS) and mitral regurgitation (MR) were observed.
Blood pressure was assessed using mean arterial pressure (MAP), measured before starting each hemodialysis session, across all 4,074 sessions performed at our clinic. At the time of transfer, her hypertension was controlled with three antihypertensive medications: two calcium channel blockers (CCBs: amlodipine besilate, nifedipine) and one angiotensin II receptor blocker (ARB: candesartan cilexetil). However, at the time of transfer, her MAP remained slightly elevated at 112.3 mm Hg, and in February 2004, the regimen was changed to three agents: a CCB (amlodipine besilate), an ARB (candesartan cilexetil), and an α-blocker (AB: doxazosin mesilate). By June 2005, the MAP showed a gradual downward trend, and the antihypertensive regimen was reduced to two agents: an ARB (candesartan cilexetil) and an AB (doxazosin mesilate). In January 2006, treatment was further reduced to a single α-blocker. In March 2007, the medication was changed to a CCB (amlodipine besilate), and MAP was controlled at 97.8 ± 11.9 mm Hg. Furthermore, in March 2012, all antihypertensive medications were successfully discontinued. However, in October 2016, hypertension recurred, triggered by below-knee amputation, and was controlled with a CCB (nifedipine) and an ARB (valsartan). In April 2017, blood pressure stabilized again, allowing antihypertensive medications to be discontinued once more. Across the 4,074 extended-hours hemodialysis sessions over the 23 years following transfer, the mean predialysis MAP was 99.4 ± 13.6 mm Hg. Cardiac function testing performed from year 7 posttransfer onward showed left ventricular ejection fraction (LVEF) values ranging from 62–72%, with a favorable mean of 68.7±3.3% (Fig. 3).
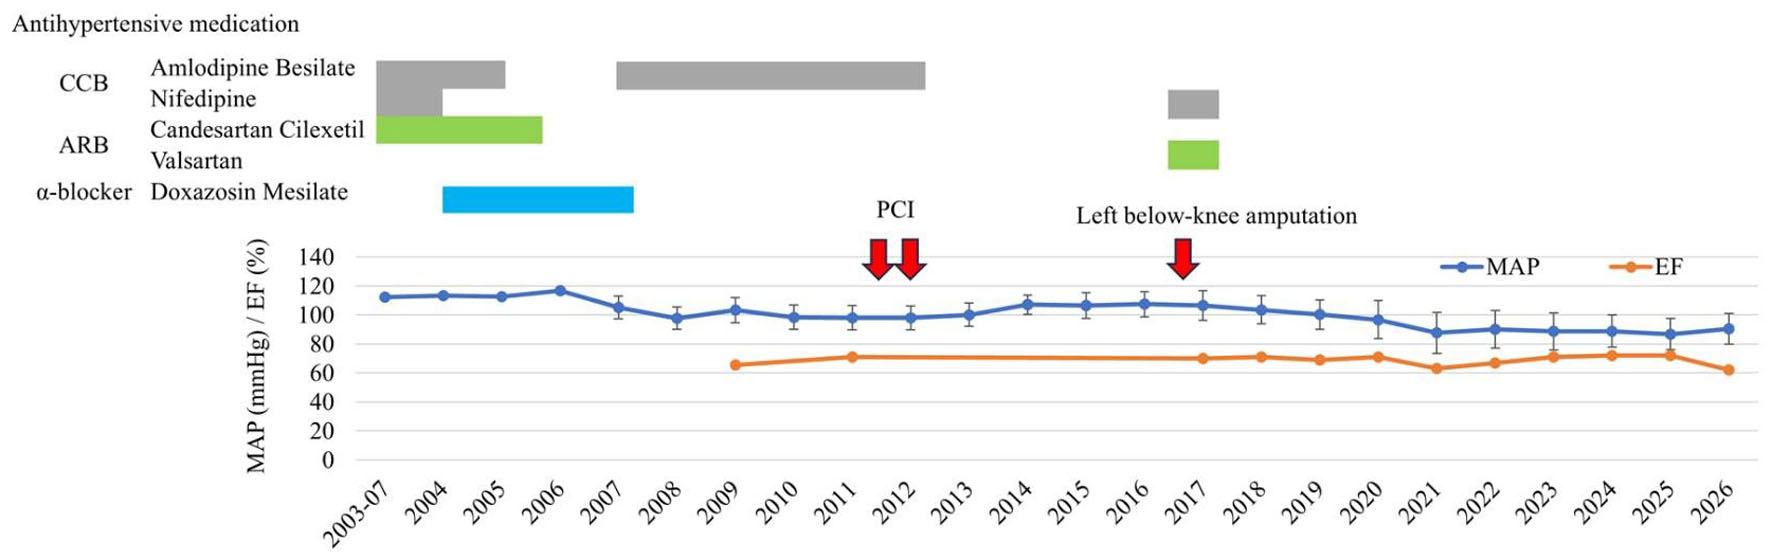 Click for large image | Figure 3. Changes in MAP and EF over the observation period. Both blood pressure and cardiac function remained stable throughout the clinical course. ARB: angiotensin II receptor blocker; CCB: calcium channel blocker; EF: ejection fraction; MAP: mean arterial pressure; PCI: percutaneous coronary intervention. |
Interdialytic weight gain was 2.54 ± 0.9 kg (7.63 kg/week) during the three-times-weekly schedule and 1.09 ± 0.5 kg (4.35 kg/week) during the four-times-weekly schedule. The corresponding ultrafiltration rates were 0.47 ± 0.2 L/h and 0.28 ± 0.1 L/h, respectively. Dialysis adequacy was assessed using standard Kt/V (stdKt/V), a weekly Kt/V metric. The stdKt/V values were 2.71 ± 0.2 for the three-times-weekly schedule, and the estimated stdKt/V values were 3.07 ± 0.17 for the four-times-weekly schedule.
Fluid status was assessed using human atrial natriuretic peptide (hANP) and the cardiothoracic ratio (CTR). The hANP levels ranged from 23.3–79.0 pg/mL, and CTR ranged from 51–55.9%. Furthermore, no history of congestive heart failure was documented during the 23 years following the transfer (Fig. 4).
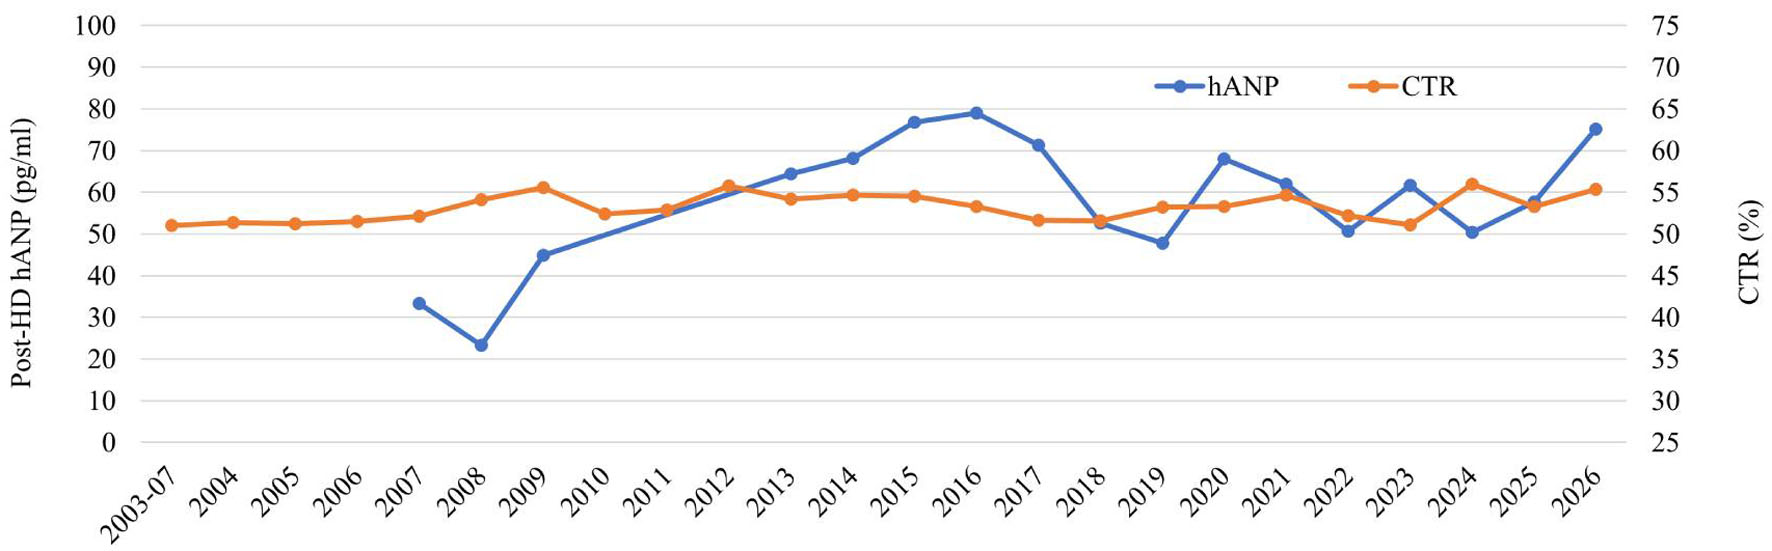 Click for large image | Figure 4. Body fluid volume assessed by hANP and CTR. CTR: cardiothoracic ratio; hANP: human atrial natriuretic peptide; HD: hemodialysis. |
BMI, an indicator of nutritional status, was calculated using dry weight (DW) postdialysis. To adjust for weight loss resulting from below-knee amputation, the weight proportions of the amputated segments were considered: 4.5–6.0% for the shank and 1.4–1.5% for the foot. For below-knee amputations, the combined proportion ranged from 5.9%–7.5%; we adopted the median value of 6.7% as the estimated correction factor [10]. We calculated body weight and BMI from October 2016 onward—after below-knee amputation—using this 6.7% correction factor.
Her BMI, an indicator of nutritional status, was 21.5 at the time of transfer to our clinic and gradually increased to 26.0 by 2009. Her BMI remained favorable from the time of transfer in 2003 through early 2016. However, as lower-limb ulcers progressed to gangrene in October 2016, culminating in left below-knee amputation, her BMI subsequently declined to 21.0 (corrected BMI 22.5). Afterward, her BMI recovered to 23.5 (corrected BMI 25.2) by 2019, reflecting a sustained improvement in nutritional status. After she turned 80 years old in 2023, her BMI again began to show a downward trend (Fig. 5a).
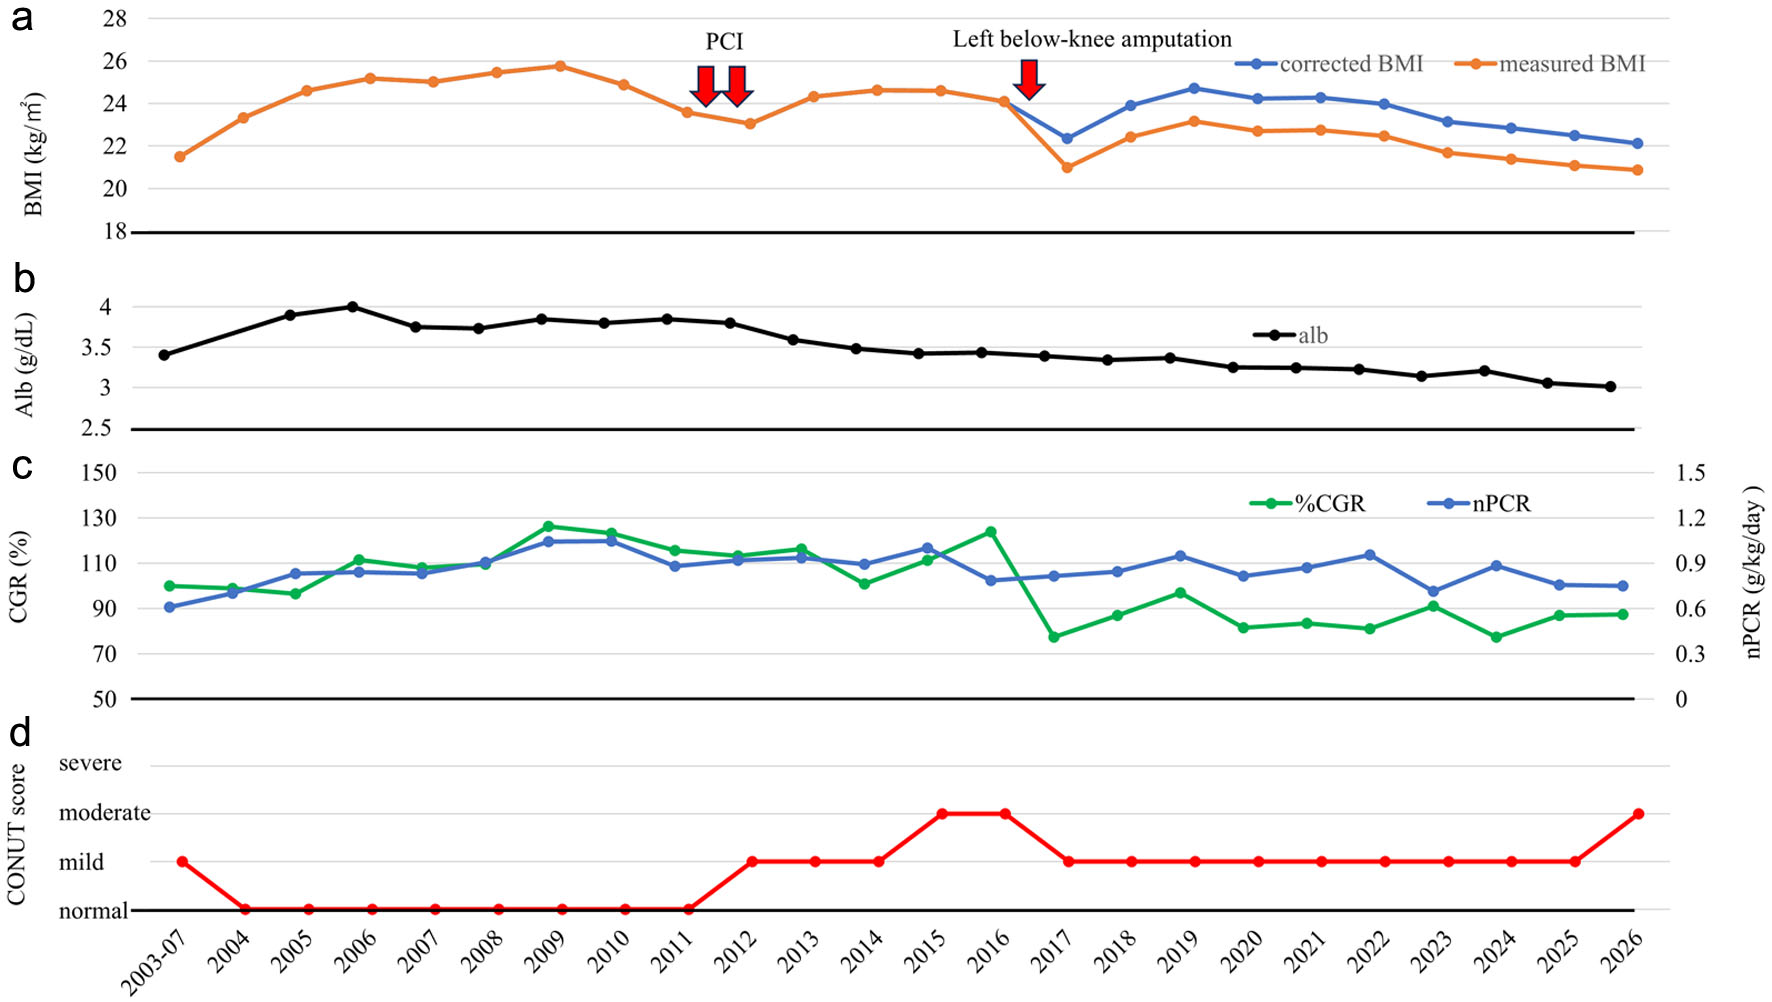 Click for large image | Figure 5. Longitudinal changes in nutritional status. (a) Changes in BMI are shown in orange, and corrected BMI is shown in blue. (b) Changes in albumin levels. (c) Trends in CGR and nPCR. The left axis shows CGR, and the right axis shows nPCR. (d) Trends in CONUT score. The CONUT score is a nutritional index calculated from serum albumin, total cholesterol, and lymphocyte count that reflects protein metabolism, lipid metabolism, and immune function. Higher scores indicate more severe nutritional or immune impairment. In this figure, nutritional status is displayed using four categories: normal, mild, moderate, and severe impairment. Alb: albumin; BMI: body mass index; CGR: creatinine generation rate; CONUT: Controlling Nutritional Status; nPCR: normalized protein catabolic rate; PCI: percutaneous coronary intervention. |
Albumin levels rose from 3.4 g/dL at transfer to 4.0 g/dL, then trended downward after PCI; since the below-knee amputation, levels have remained in the 3.0–3.4 g/dL range (Fig. 5b).
The creatinine generation rate (CGR), an indicator of muscle mass, showed an increasing trend after transfer to our clinic, reaching 126.3% in 2009. During the same period, the normalized protein catabolic rate (nPCR), an indicator of protein intake, likewise rose from a low value of 0.61 at transfer to 1.05 as dietary intake increased. Both indicators subsequently remained favorable; however, from 2016 onward, as inflammation and pain from the lower-extremity ulcers worsened, nPCR showed a downward trend (Fig. 5c).
We evaluated the Controlling Nutritional Status (CONUT) score—an indicator of nutritional status and immune function—over time. Although the score was in the “mild” range at transfer, it was “normal” between 2004 and 2012. It shifted to “mild” following PCI and progressed to “moderate” during the advanced stage of lower-limb gangrene, but improved to “mild” after lower-limb amputation. In 2026, it was in the “moderate” range (Fig. 5d).
After being diagnosed with impaired blood flow in the lower limbs, the patient actively engaged in exercise therapy. Even following the amputation of the left below-knee, the patient independently continued strength training for the remaining limb and core balance exercises. Even at age 83, the patient was still receiving outpatient dialysis and could stand on the right leg alone during weight measurements at the dialysis center. Additionally, the patient transferred independently between the wheelchair and the bed.
Serum phosphate and serum calcium, both risk factors for vascular calcification, remained within the normal range throughout. However, intact parathyroid hormone (iPTH) levels rose on two occasions, to 230.9 ± 75.5 pg/mL in 2012 and 305.6 ± 132.9 pg/mL in 2019, and were controlled with calcimimetics on both occasions. Serum phosphate levels were initially managed with the phosphate binder calcium carbonate 4.5 g/day at the time of transfer; the dose was gradually reduced to 2 g/day in 2007, and to 1 g/day in 2010, before being discontinued entirely in 2016 (Fig. 6).
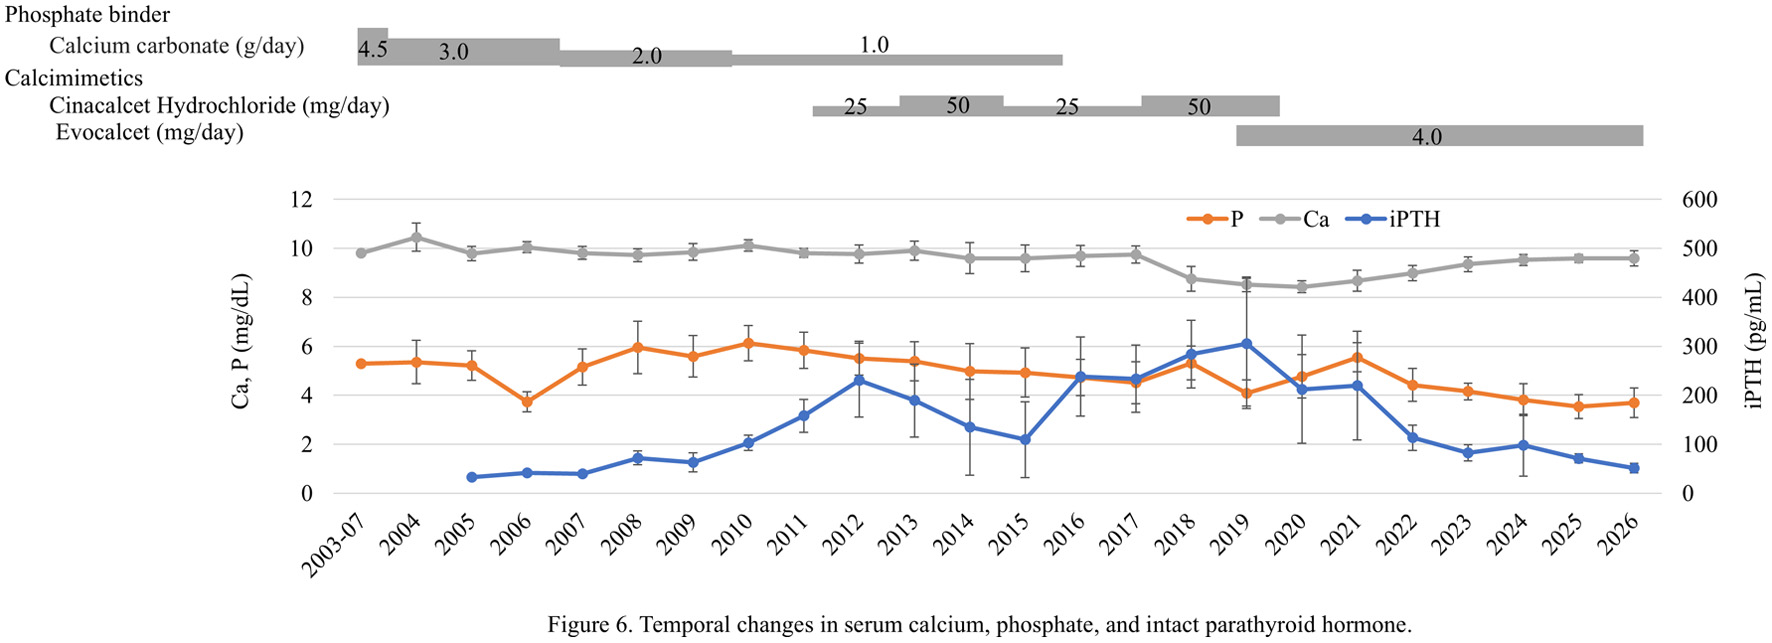 Click for large image | Figure 6. Temporal changes in serum calcium, phosphate, and intact parathyroid hormone. Serum phosphate levels were initially managed with calcium carbonate, which was gradually tapered and eventually discontinued. Although iPTH levels rose on two occasions, calcimimetics effectively controlled these elevations. Ca: calcium; iPTH: intact parathyroid hormone; P: phosphate. |
Laboratory data represent mean ± standard deviation (SD) values obtained over the 23 years following transfer to our clinic (Table 1). Mean serum phosphate, serum calcium, and iPTH levels, all risk factors for vascular calcification, were 4.8 ± 1.0 mg/dL, 8.9 ± 0.8 mg/dL, and 162.0 ± 109.1 pg/mL, respectively. Serum albumin level, an indicator of nutritional status, was 3.3 ± 0.3 g/dL. Cholesterol levels remained within the normal range throughout. In addition, Figure 7 shows the temporal changes in potassium and sodium.
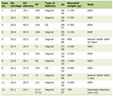 Click to view | Table 1. Average Laboratory Data for 23 Years After Transfer (July 2003 to June 2026) |
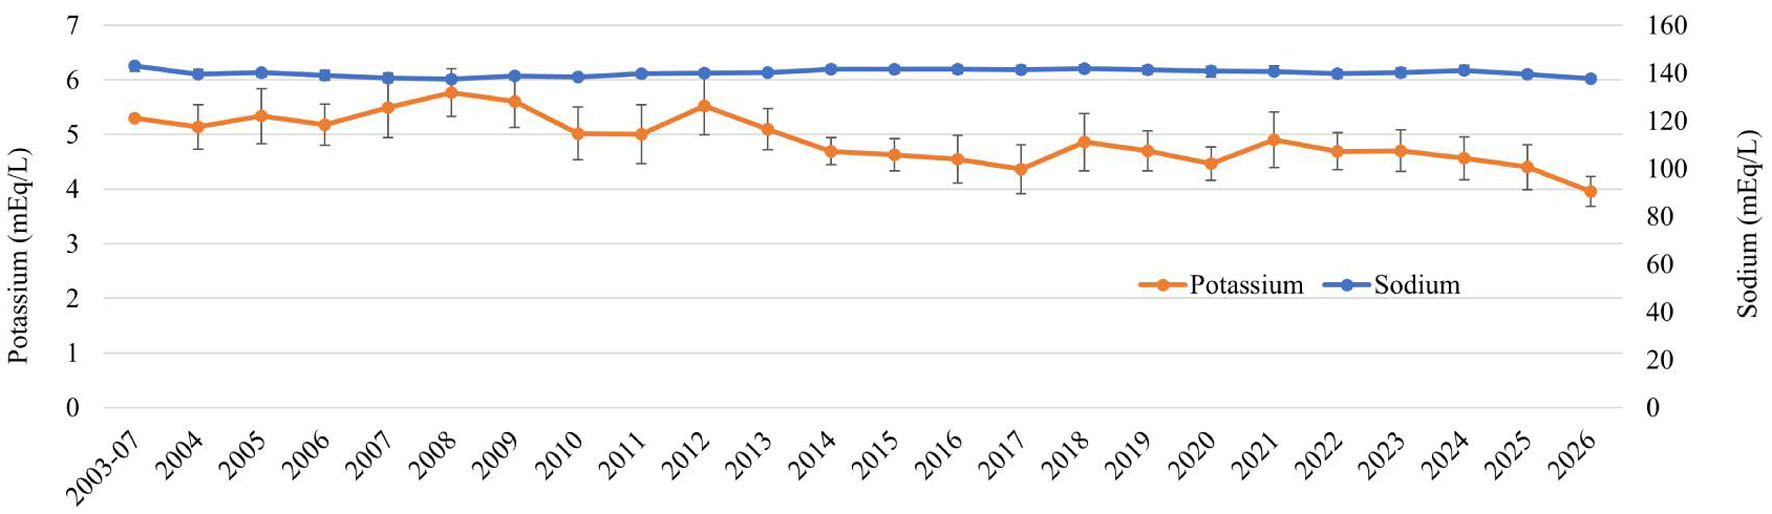 Click for large image | Figure 7. Temporal changes in electrolytes: potassium and sodium. Potassium is shown on the left axis, and sodium on the right. |
The mean blood flow rate (Qb) during hemodialysis was 142.1 ± 17.6 mL/min, with a dialysate flow rate (Qd) of 300 mL/min. A defining feature of our extended-hours hemodialysis is that it allows for gentler hemodialysis than conventional hemodialysis (Qb ≥ 200 mL/min, Qd 500 mL/min). Despite this, single-pool Kt/V averaged 1.76 ± 0.13, indicating that an adequate hemodialysis dose was achieved. Dialysate composition was as follows: Na+ = 140 mEq/L, K+ = 2.0 mEq/L, Ca2+ = 3.0 mEq/L, and Glu = 100 mg/dL (Table 2).
Click to view | Table 2. Average Hemodialysis Procedure Data for 23 Years After Transfer |
Missing data periods were limited to approximately 1 month (October to November 2016) around the below-knee amputation and the 2 days when endovascular therapy was performed (July 2024 and January 2025). We obtained clinical information by carefully reviewing paper medical records for the first 5 years following transfer and electronic medical records for the subsequent 18 years. The error bars shown in the figures represent the SD of the averaged data for each year.
| Discussion | ▴Top |
This patient was an 83-year-old woman who initially received CAPD and subsequently underwent 23 years of extended-hours hemodialysis with a liberalized diet after transferring to our clinic. Interestingly, despite having diabetes and severe diabetic complications, she maintained a stable clinical course over a long period.
Rivara et al. reported in a large observational cohort study that extended-hours hemodialysis was associated with a 34% reduction in mortality compared with conventional hemodialysis. Patients who received extended-hours hemodialysis also tended to include many individuals with major comorbid conditions, most notably diabetes and cardiovascular disease, both of which are typically tied to poor survival. Even with the considerable burden of these conditions, extended-hours hemodialysis remained associated with improved survival [11, 12]. Furthermore, Okazaki et al. investigated mortality risk among patients who received extended-hours hemodialysis with a liberalized diet compared with those who received conventional hemodialysis. In the subgroup of patients with diabetes, the hazard ratio was 0.71 (95% confidence interval: 0.44–1.16); however, because no statistically significant difference was observed, the presence or absence of an effect could not be determined [13].
The mechanism by which extended-hours hemodialysis reduces mortality in patients with diabetes remains unclear. However, several factors may have contributed to the long-term survival observed in this case. This patient had already presented with two severe diabetic complications. The first was severe stenosis of the left coronary artery due to vascular calcification. However, in this case, the LVEF remained within the normal range, and cardiac function was preserved without decline. Hemodialysis patients have been reported to have substantially higher rates of mortality, cardiovascular death, and major cardiac events after PCI compared with patients with normal renal function [14]. However, extended-hours hemodialysis and frequent dialysis have been suggested to improve cardiac function and reduce cardiac hypertrophy, potentially conferring cardiovascular benefits [15]. In addition, it is important that BMI, which had decreased at the time of PCI, gradually increased postoperatively.
The second severe diabetes-related complication was a left below-knee amputation performed for critical limb ischemia. Survival after major lower-limb amputation in hemodialysis patients is extremely poor, with reported rates of 54–56% at 1 year and 13–18% at 5 years, and a mean survival period of only 1.3–1.7 years [16–18]. Notably, low BMI among hemodialysis patients with diabetes substantially increases mortality regardless of age [19]. In this case, when assessing uncorrected BMI after below-knee amputation, the observed 12.9% reduction in BMI corresponded to a 6.6% decrease when the corrected BMI was applied. Therefore, this BMI decrease reflected the physical loss from below-knee amputation and did not indicate rapid deterioration in nutritional status. However, the potential impact of hospitalization and reduced physical activity on BMI cannot be ruled out, and a mild but genuine decline in nutritional status may have occurred. Notably, she had a high level of health literacy regarding rehabilitation and consistently engaged in rehabilitation efforts. She also maintained independence in activities of daily living despite using a wheelchair; it is noteworthy that 9 years have passed since the below-knee amputation.
Although we attempted to apply corrections to the CGR, nPCR, and Geriatric Nutritional Risk Index (GNRI) [20–23], we found no reports supporting these correction methods; therefore, we did not apply corrections to these parameters in this study. Thus, the nutritional indices evaluated in this study (CGR, nPCR, and GNRI) may not reflect the true nutritional status after below-knee amputation.
The CONUT score is an index used to evaluate protein metabolism, lipid metabolism, and immune function [24]. In this case, the changes in the score appear to reflect shifts in the patient’s nutritional and immunological status. Although the patient had mild malnutrition at transfer, the score remained within the normal range between 2004 and 2012, indicating stable nutritional and immune status. During the progressive phase of lower-limb gangrene, severe inflammation associated with ischemia, infection, and necrosis decreased albumin, lymphocyte count, and total cholesterol, resulting in a decline to moderate malnutrition. After amputation, removal of the source of inflammation reduced systemic inflammation; consequently, lymphocyte counts and total cholesterol improved, and the patient's status improved to mild malnutrition. However, her status returned to moderate malnutrition in 2026, a change that may have been influenced by multiple factors, such as aging and reduced nutritional intake.
As the patient underwent frequent dialysis (four times weekly), assessment was based on stdKt/V. Since actual single-pool Kt/V (spKt/V) measurements were obtained only during the single 5-hour session at the start of the week, stdKt/V was calculated using a urea kinetic model that assumed a uniform schedule of four 5-h sessions per week (5–5–5–5 h). Because the actual clinical regimen involved a long-duration schedule of 5–6–7–7 h, the calculated value might be slightly lower than the true value; therefore, the result was designated as “estimated stdKt/V”. A target stdKt/V of 2.3 or higher is recommended [25]. The stdKt/V values for the three-times-weekly and four-times-weekly schedules were 2.71 ± 0.2 and 3.07 ± 0.17 (estimated), respectively, indicating an adequate dialysis dosage in both cases.
This patient demonstrated severe vascular calcification. At the time of transfer, calcium carbonate was being taken; however, extending hemodialysis duration improved serum phosphate control, allowing calcium carbonate to be eventually discontinued. Levels of iPTH were controlled with calcimimetics. Excessive calcium load from calcium-based phosphate binders is associated with the progression of vascular calcification [26]. Elevated iPTH levels have also been reported to be associated with the progression of vascular calcification [27]. The iPTH levels were effectively controlled with calcimimetics, which have been reported to exert a more inhibitory effect on vascular calcification than vitamin D3 preparations [28]. Nevertheless, the severe calcification suggests that the pathophysiology of this case extends beyond simple phosphate and calcium loading or parathyroid hormone (PTH) management. In chronic kidney disease, vascular calcification tends to progress and become severe from the early stages of renal function decline [29, 30]. In particular, patients with diabetes have been shown to have a higher risk of accelerated vascular calcification [31]. In this case as well, atherosclerotic lesions were already identified from the early stages of RRT initiation, suggesting acceleration of diabetes-related vascular damage. Extended-hours hemodialysis did not completely inhibit vascular calcification.
Our treatment approach—extended-hours hemodialysis with a liberalized diet—raises one concern: increased food intake may make blood glucose control more difficult. Insulin resistance has been reported to be exacerbated in end-stage renal failure, and improving insulin resistance may contribute to the suppression of blood glucose fluctuations, leading to more stable blood glucose management [32]. High urea levels and accumulation of uremic substances, such as protein-bound uremic toxins (PBUTs), exacerbate insulin resistance [33]. Extended-hours hemodialysis is superior in removing uremic toxins. It clears small- and middle-molecule uremic toxins more effectively from deep compartments [34]. Moreover, the removal of PBUTs has been reported to be higher than with conventional hemodialysis [35].
In this case, muscle mass was maintained until the below-knee amputation. Skeletal muscle is the primary site of insulin resistance because it plays a central role in glucose metabolism. Although obesity has traditionally been regarded as the major contributor to insulin resistance, recent attention has focused on the reduction in skeletal muscle mass due to protein-energy wasting (PEW), which has emerged as an independent factor that exacerbates insulin resistance [7]. Furthermore, metabolomics studies have reported that the concentrations of all branched-chain amino acids, which promote muscle protein synthesis and help maintain muscle mass, were higher in the extended-hours hemodialysis group than in the conventional hemodialysis group [36]. In addition to these insights, recent metabolomics research suggests that comprehensive molecular-level analysis, biomarker discovery, and combined targeted and untargeted analyses are valuable for capturing metabolic changes from a broader perspective. Leveraging these approaches may enable a clearer assessment of the metabolic changes associated with extended-hours hemodialysis [37, 38].
α-GIs were selected because they carry an extremely low risk of hypoglycemia when used as monotherapy, and their pharmacological action—targeting postprandial hyperglycemia—aligns well with a liberalized dietary approach. Conversely, insulin and glinides were avoided due to the risk of hypoglycemia in elderly dialysis patients with coronary artery disease [39].
A challenge in managing dialysis patients is that HbA1c levels do not always accurately reflect actual glycemic status. HbA1c tends to appear falsely low due to factors such as shortened red blood cell lifespan (caused by uremia, dialysis-induced hemolysis, or residual blood in the circuit) and an increased proportion of immature red blood cells resulting from the rapid stimulation of erythropoiesis by erythropoiesis-stimulating agents [40, 41]. In this case, the average erythropoiesis-stimulating agent dose per session over the 23-year dialysis period was 713.1 IU. Furthermore, GA levels fluctuate for reasons beyond blood glucose, including hypoalbuminemia, inflammation, and albumin loss related to nutritional status [42]. Therefore, we presented a comprehensive assessment based on three parameters: HbA1c, GA, and pre-dialysis random blood glucose.
Extended-hours hemodialysis with a liberalized diet led to stable blood pressure, maintained cardiac function, and electrolyte balance, which we believe contributed significantly to the treatment’s effectiveness. In contrast, factors such as good glycemic control, continued physical activity, the ability to lead an independent life even after lower-limb amputation, and the ability to continue long-term extended-hours hemodialysis for 23 years are primarily attributable to the patient herself. Therefore, when interpreting this case’s clinical course, it is necessary to consider both the effects of dialysis therapy and the patient’s individual characteristics.
This study has several limitations. First, it was based on a single case, and no comparison was made with patients undergoing conventional hemodialysis. Second, this patient had high health literacy and actively engaged in rehabilitation. It is impossible to rule out the possibility that these factors influenced the clinical course independently of the intervention, potentially introducing selection bias or confounding. Third, this case was unusual in that good glycemic control was achieved with α-GIs alone. Her history of treatment for diabetic retinopathy and the development of lower-extremity ulcers associated with peripheral artery disease leave open the possibility that her diabetes had already been complicated by vascular disease from the early stages of RRT initiation. Fourth, the relationship between changes in muscle mass and the insulin resistance index could not be evaluated due to the retrospective nature of the study.
Conclusions
In this case, multiple factors—including adequate dialysis dosage, high health literacy, and active rehabilitation—may have influenced changes in muscle mass and clinical outcomes during a treatment course involving extended-hours hemodialysis with a liberalized diet. The observed changes are considered to be the result of multiple contributing factors. While this case offers important insights into the prognosis of patients with diabetes undergoing hemodialysis, it does not establish a definitive causal relationship. Further studies involving additional similar cases are needed to advance understanding of prognosis in patients with diabetes undergoing hemodialysis.
Learning points
In patients with diabetes undergoing hemodialysis, both blood glucose control and nutritional management are essential; however, these two objectives often conflict, presenting a therapeutic challenge. There may be a close association between muscle mass and glycemic control in patients with diabetes undergoing hemodialysis, and muscle mass could be a crucial factor influencing survival. The clinical course of this case highlights the need to comprehensively evaluate nutritional status, muscle mass, and glycemic control in dialysis patients.
Acknowledgments
None to declare.
Financial Disclosure
None to declare.
Conflict of Interest
None to declare.
Informed Consent
The patient provided written informed consent for publication of data from this study, including image data.
Author Contributions
FK, HK, and TN contributed to writing the manuscript. KO, KK, and KS reviewed and adjusted the manuscript before submission.
Data Availability
The authors declare that data supporting the findings of this study are available within the article.
Abbreviations
CAPD: continuous ambulatory peritoneal dialysis; CGR: creatinine generation rate; GA: glycated albumin; MDCT: multidetector computed tomography; nPCR: normalized protein catabolic rate; PCI: percutaneous coronary intervention; PEW: protein-energy wasting; RRT: renal replacement therapy; UFR: ultrafiltration rate
| References | ▴Top |
- Stratton IM, Adler AI, Neil HA, Matthews DR, Manley SE, Cull CA, Hadden D, et al. Association of glycaemia with macrovascular and microvascular complications of type 2 diabetes (UKPDS 35): prospective observational study. BMJ. 2000;321(7258):405-412.
doi pubmed - Navaneethan SD, Schold JD, Jolly SE, Arrigain S, Winkelmayer WC, Nally JV, Jr. Diabetes control and the risks of ESRD and mortality in patients with CKD. Am J Kidney Dis. 2017;70(2):191-198.
doi pubmed - Ricks J, Molnar MZ, Kovesdy CP, Shah A, Nissenson AR, Williams M, Kalantar-Zadeh K. Glycemic control and cardiovascular mortality in hemodialysis patients with diabetes: a 6-year cohort study. Diabetes. 2012;61(3):708-715.
doi pubmed - Bataille S, Landrier JF, Astier J, Cado S, Sallette J, Giaime P, Sampol J, et al. Haemodialysis patients with diabetes eat less than those without: a plea for a permissive diet. Nephrology (Carlton). 2017;22(9):712-719.
doi pubmed - Karatas YF, Topal GG, Gumus D, Kizil M. The link between dietary indices, sarcopenia, and clinical parameters in diabetic and non-diabetic hemodialysis patients. J Clin Med. 2026;15(13):4923.
doi pubmed - Kalantar-Zadeh K, Ikizler TA, Block G, Avram MM, Kopple JD. Malnutrition-inflammation complex syndrome in dialysis patients: causes and consequences. Am J Kidney Dis. 2003;42(5):864-881.
doi pubmed - Liu ZJ, Zhu CF. Causal relationship between insulin resistance and sarcopenia. Diabetol Metab Syndr. 2023;15(1):46.
doi pubmed - Hocher B, Ziebig R, Altermann C, Krause R, Asmus G, Richter CM, Slowinski T, et al. Different impact of biomarkers as mortality predictors among diabetic and nondiabetic patients undergoing hemodialysis. J Am Soc Nephrol. 2003;14(9):2329-2337.
doi pubmed - Broumand B. Diabetes: changing the fate of diabetics in the dialysis unit. Blood Purif. 2007;25(1):39-47.
doi pubmed - de Leva P. Adjustments to Zatsiorsky-Seluyanov's segment inertia parameters. J Biomech. 1996;29(9):1223-1230.
doi pubmed - Rivara MB, Adams SV, Kuttykrishnan S, Kalantar-Zadeh K, Arah OA, Cheung AK, Katz R, et al. Extended-hours hemodialysis is associated with lower mortality risk in patients with end-stage renal disease. Kidney Int. 2016;90(6):1312-1320.
doi pubmed - Wald R, Perl J. Extended hours hemodialysis and survival: extended hours, extended evidence? Kidney Int. 2016;90(6):1155-1157.
doi pubmed - Okazaki M, Inaguma D, Imaizumi T, Hishida M, Kurasawa S, Kubo Y, Kato S, et al. Impact of old age on the association between in-center extended-hours hemodialysis and mortality in patients on incident hemodialysis. PLoS One. 2020;15(7):e0235900.
doi pubmed - Nagaraja V, Lewis BR, Korsapati H, Mene-Afejuku TO, Dillon JJ, Cheungpasitporn W, Gharacholou M, et al. Ten-year clinical outcomes and cause of death in patients on dialysis undergoing percutaneous coronary intervention: a retrospective Mayo clinic PCI registry analysis. Mayo Clin Proc. 2026;101(8):1277-1287.
doi pubmed - Susantitaphong P, Koulouridis I, Balk EM, Madias NE, Jaber BL. Effect of frequent or extended hemodialysis on cardiovascular parameters: a meta-analysis. Am J Kidney Dis. 2012;59(5):689-699.
doi pubmed - Serizawa F, Sasaki S, Fujishima S, Akamatsu D, Goto H, Amada N. Mortality rates and walking ability transition after lower limb major amputation in hemodialysis patients. J Vasc Surg. 2016;64(4):1018-1025.
doi pubmed - Aulivola B, Hile CN, Hamdan AD, Sheahan MG, Veraldi JR, Skillman JJ, Campbell DR, et al. Major lower extremity amputation: outcome of a modern series. Arch Surg. 2004;139(4):395-399; discussion 399.
doi pubmed - Arhuidese I, Nejim B, Aji EA, Canner J, Malas MB. Survival after major lower extremity amputation in patients with end-stage renal disease. J Vasc Surg. 2019;70(4):1291-1298.
doi pubmed - Toida T, Sato Y, Ogata S, Wada A, Masakane I, Fujimoto S. Synergic Impact of Body Mass Index, Diabetes, and Age on Long-Term Mortality in Japanese Incident Hemodialysis Patients: A Cohort Study on a Large National Dialysis Registry. J Ren Nutr. 2020;30(4):333-340.
doi pubmed - Shinzato T, Nakai S, Miwa M, Iwayama N, Takai I, Matsumoto Y, Morita H, et al. New method to calculate creatinine generation rate using pre- and postdialysis creatinine concentrations. Artif Organs. 1997;21(8):864-872.
doi pubmed - Shinzato T, Nakai S, Fujita Y, Takai I, Morita H, Nakane K, Maeda K. Determination of Kt/V and protein catabolic rate using pre- and postdialysis blood urea nitrogen concentrations. Nephron. 1994;67(3):280-290.
doi pubmed - Bouillanne O, Morineau G, Dupont C, Coulombel I, Vincent JP, Nicolis I, Benazeth S, et al. Geriatric Nutritional Risk Index: a new index for evaluating at-risk elderly medical patients. Am J Clin Nutr. 2005;82(4):777-783.
doi pubmed - Yamada K, Furuya R, Takita T, Maruyama Y, Yamaguchi Y, Ohkawa S, Kumagai H. Simplified nutritional screening tools for patients on maintenance hemodialysis. Am J Clin Nutr. 2008;87(1):106-113.
doi pubmed - Ignacio de Ulibarri J, Gonzalez-Madrono A, de Villar NG, Gonzalez P, Gonzalez B, Mancha A, Rodriguez F, et al. CONUT: a tool for controlling nutritional status. First validation in a hospital population. Nutr Hosp. 2005;20(1):38-45.
pubmed - National Kidney Foundation. KDOQI clinical practice guideline for hemodialysis adequacy: 2015 update. Am J Kidney Dis. 2015;66(5):884-930.
doi pubmed - Guerin AP, London GM, Marchais SJ, Metivier F. Arterial stiffening and vascular calcifications in end-stage renal disease. Nephrol Dial Transplant. 2000;15(7):1014-1021.
doi pubmed - Palamar M, Grosu Radulescu ID, Tanasescu MD, Sircuta A, Bob F. Vascular calcification in chronic kidney disease and hemodialysis: pathophysiological mechanisms and emerging biomarkers. Medicina (Kaunas). 2025;61(12):2169.
doi pubmed - Chandu A, Arana C, Diaz-Garcia JD, Cozzolino M, Ciceri P, Torregrosa JV. Calcimimetics and vascular calcification. Toxins (Basel). 2025;17(6):297.
doi pubmed - Phan O, Joki N. Vascular calcification in diabetic kidney disease. Kidney Dial. 2022;2(4):595-606.
- Kobayashi S, Oka M, Maesato K, Ikee R, Mano T, Hidekazu M, Ohtake T. Coronary artery calcification, ADMA, and insulin resistance in CKD patients. Clin J Am Soc Nephrol. 2008;3(5):1289-1295.
doi pubmed - Mehrotra R, Budoff M, Hokanson JE, Ipp E, Takasu J, Adler S. Progression of coronary artery calcification in diabetics with and without chronic kidney disease. Kidney Int. 2005;68(3):1258-1266.
doi pubmed - Shrishrimal K, Hart P, Michota F. Managing diabetes in hemodialysis patients: observations and recommendations. Cleve Clin J Med. 2009;76(11):649-655.
doi pubmed - Pieniazek A, Bernasinska-Slomczewska J, Gwozdzinski L. Uremic toxins and their relation with oxidative stress induced in patients with CKD. Int J Mol Sci. 2021;22(12):6196.
doi pubmed - Basile C, Libutti P, Di Turo AL, Casino FG, Vernaglione L, Tundo S, Maselli P, et al. Removal of uraemic retention solutes in standard bicarbonate haemodialysis and long-hour slow-flow bicarbonate haemodialysis. Nephrol Dial Transplant. 2011;26(4):1296-1303.
doi pubmed - Cornelis T, Eloot S, Vanholder R, Glorieux G, van der Sande FM, Scheijen JL, Leunissen KM, et al. Protein-bound uraemic toxins, dicarbonyl stress and advanced glycation end products in conventional and extended haemodialysis and haemodiafiltration. Nephrol Dial Transplant. 2015;30(8):1395-1402.
doi pubmed - Takami N, Okazaki M, Ozeki T, Imaizumi T, Nishibori N, Kurasawa S, Hishida M, et al. Plasma Metabolite Profiles Between In-Center Daytime Extended-Hours and Conventional Hemodialysis. Kidney360. 2025;6(3):420-431.
doi pubmed - Emwas AH, Szczepski K, Poulson BG, Chandra K, McKay RT, Dhahri M, Alahmari F, et al. NMR as a "Gold Standard" method in drug design and discovery. Molecules. 2020;25(20):4597.
doi pubmed - Emwas AH, Roy R, McKay RT, Tenori L, Saccenti E, Gowda GAN, Raftery D, et al. NMR spectroscopy for metabolomics research. Metabolites. 2019;9(7):123.
doi pubmed - Shimabukuro M, Tanaka A, Sata M, Dai K, Shibata Y, Inoue Y, Ikenaga H, et al. alpha-Glucosidase inhibitor miglitol attenuates glucose fluctuation, heart rate variability and sympathetic activity in patients with type 2 diabetes and acute coronary syndrome: a multicenter randomized controlled (MACS) study. Cardiovasc Diabetol. 2017;16(1):86.
doi pubmed - Uzu T, Hatta T, Deji N, Izumiya T, Ueda H, Miyazawa I, Kanasaki M, et al. Target for glycemic control in type 2 diabetic patients on hemodialysis: effects of anemia and erythropoietin injection on hemoglobin A(1c). Ther Apher Dial. 2009;13(2):89-94.
doi pubmed - Nakao T, Inaba M, Abe M, Kaizu K, Shima K, Babazono T, Tomo T, et al. Best practice for diabetic patients on hemodialysis 2012. Ther Apher Dial. 2015;19(Suppl 1):40-66.
doi pubmed - Raghav A, Ahmad J. Glycated albumin in chronic kidney disease: Pathophysiologic connections. Diabetes Metab Syndr. 2018;12(3):463-468.
doi pubmed
This article is distributed under the terms of the Creative Commons Attribution 4.0 International License (CC BY 4.0), which permits unrestricted use, distribution, and reproduction in any medium, including commercial use, provided the original work is properly cited.
Journal of Medical Cases is published by Elmer Press Inc.