Figures
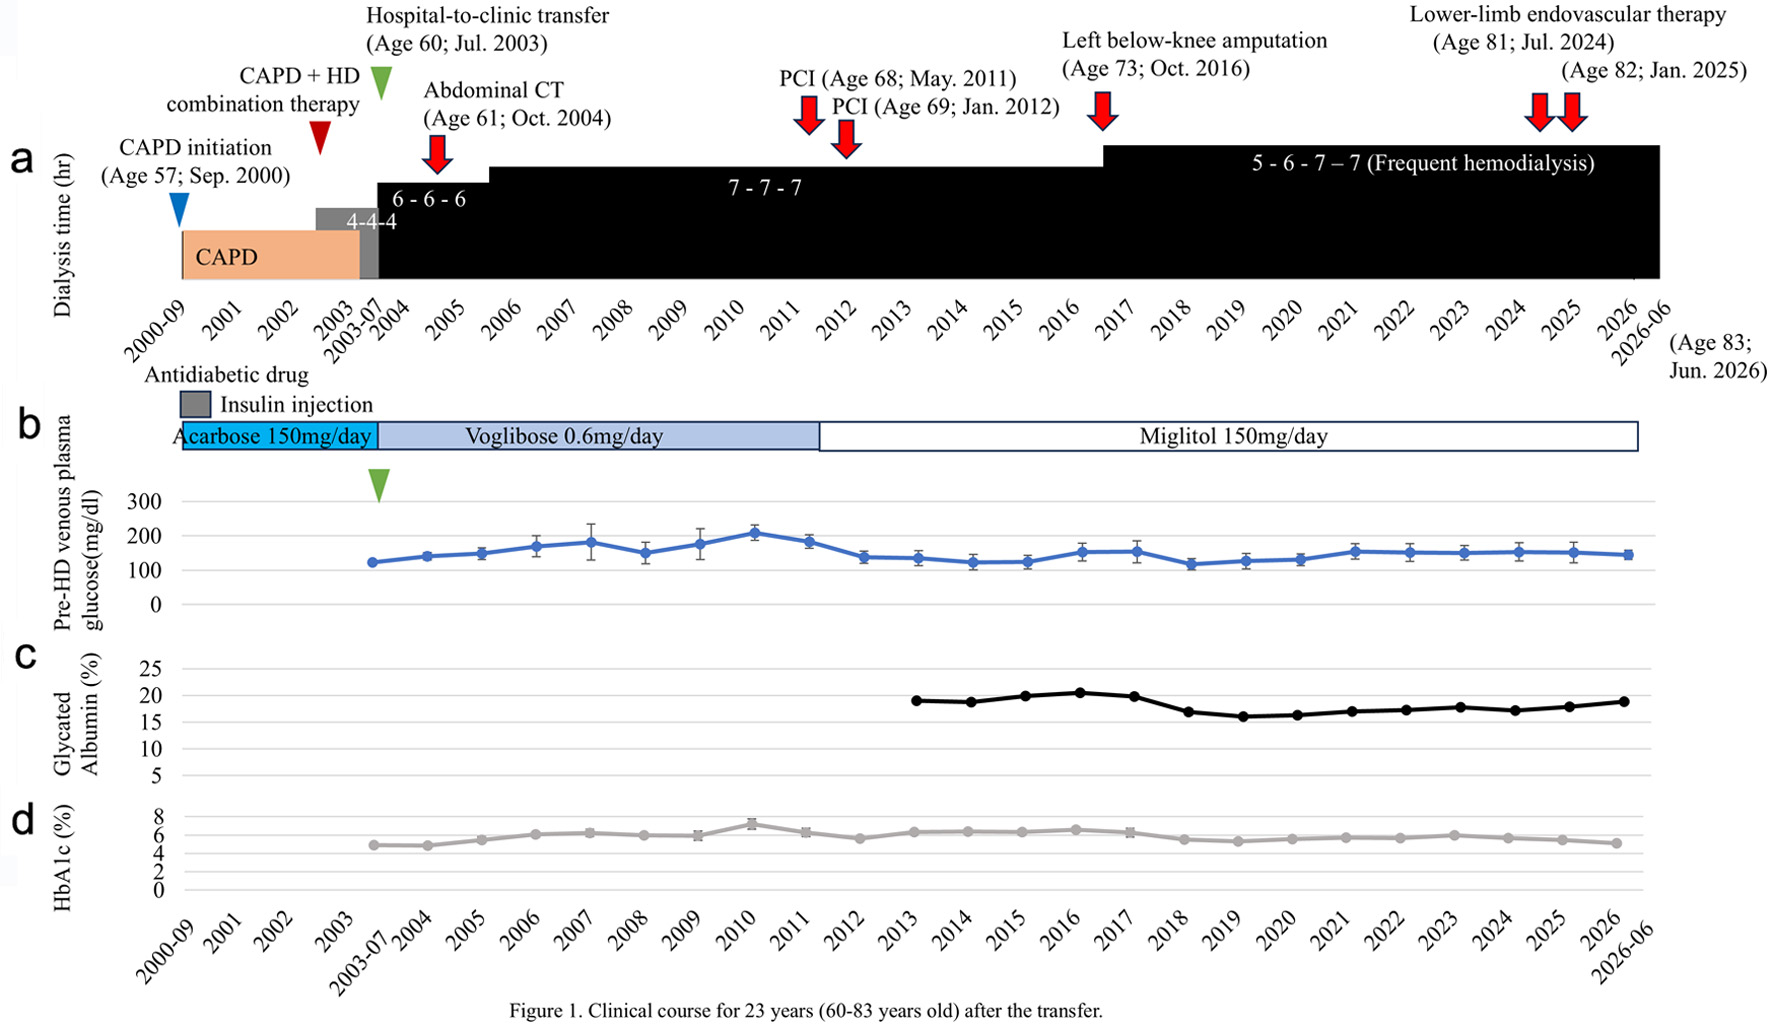
↓ Figure 1. Clinical course over 23 years (60–83 years old) after the transfer. (a) After transfer, the patient initiated extended-hours hemodialysis with a liberalized diet at 6 h per session. The dialysis duration was gradually extended and, triggered by a left below-knee amputation in October 2016, the regimen shifted to frequent, extended-hours hemodialysis four times a week. This extended-hours hemodialysis with a liberalized diet continued for 23 years. (b) Changes in prehemodialysis venous plasma glucose and hypoglycemic medications. (c) Changes in glycated albumin levels. (d) Changes in HbA1c levels. CAPD: continuous ambulatory peritoneal dialysis; CT: computed tomography; GA: glycated albumin; HbA1c: hemoglobin A1c; HD: hemodialysis; PCI: percutaneous coronary intervention.
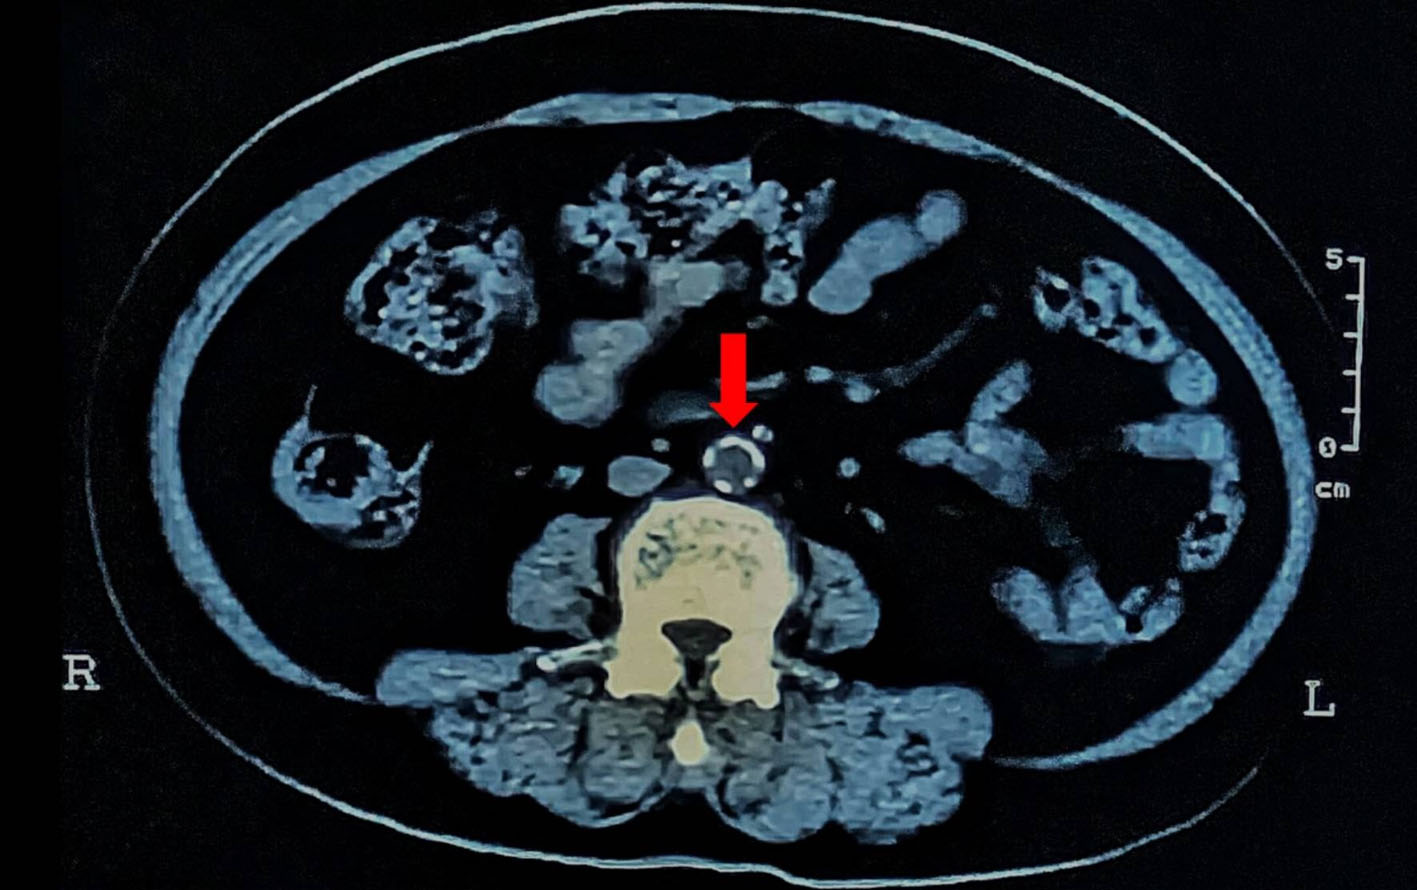
↓ Figure 2. Abdominal aortic CT image 1 year after transfer. One year after transfer (at age 61), severe circumferential vascular calcification is already evident in the abdominal aorta. The red arrow indicates the calcified areas of the abdominal aorta.
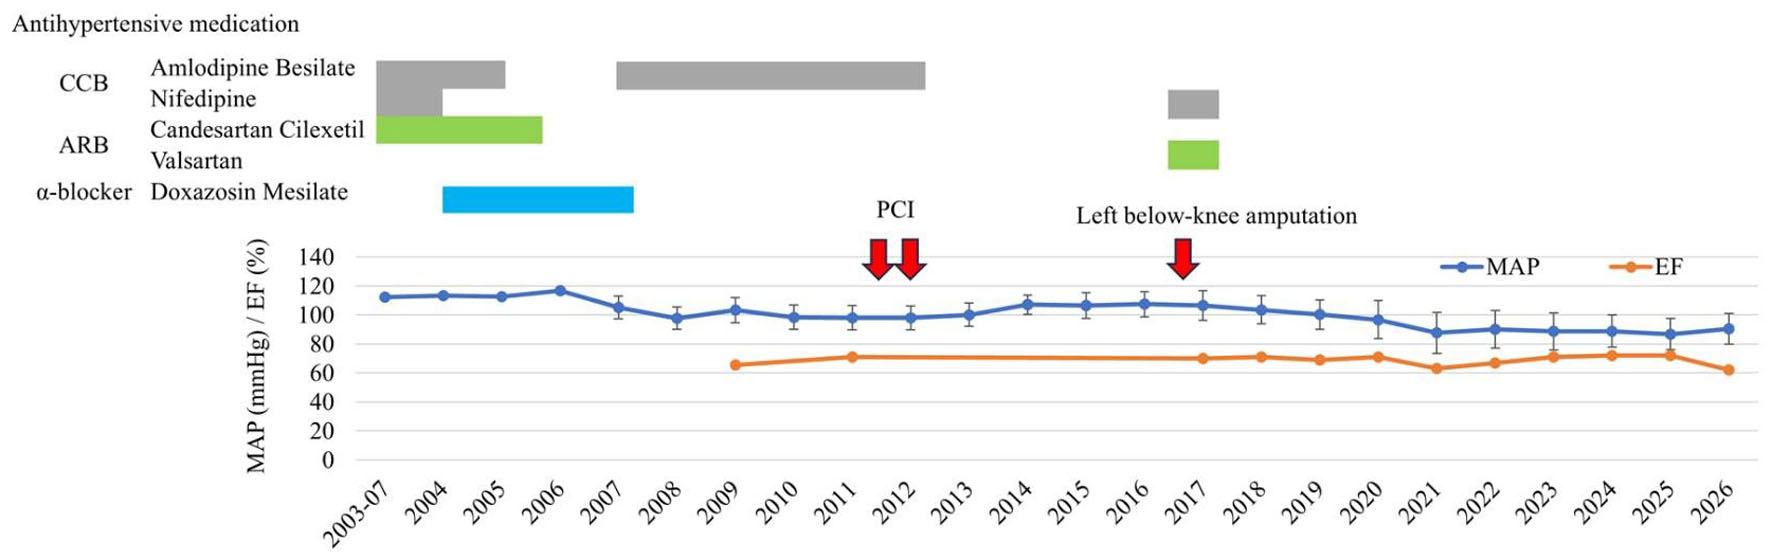
↓ Figure 3. Changes in MAP and EF over the observation period. Both blood pressure and cardiac function remained stable throughout the clinical course. ARB: angiotensin II receptor blocker; CCB: calcium channel blocker; EF: ejection fraction; MAP: mean arterial pressure; PCI: percutaneous coronary intervention.
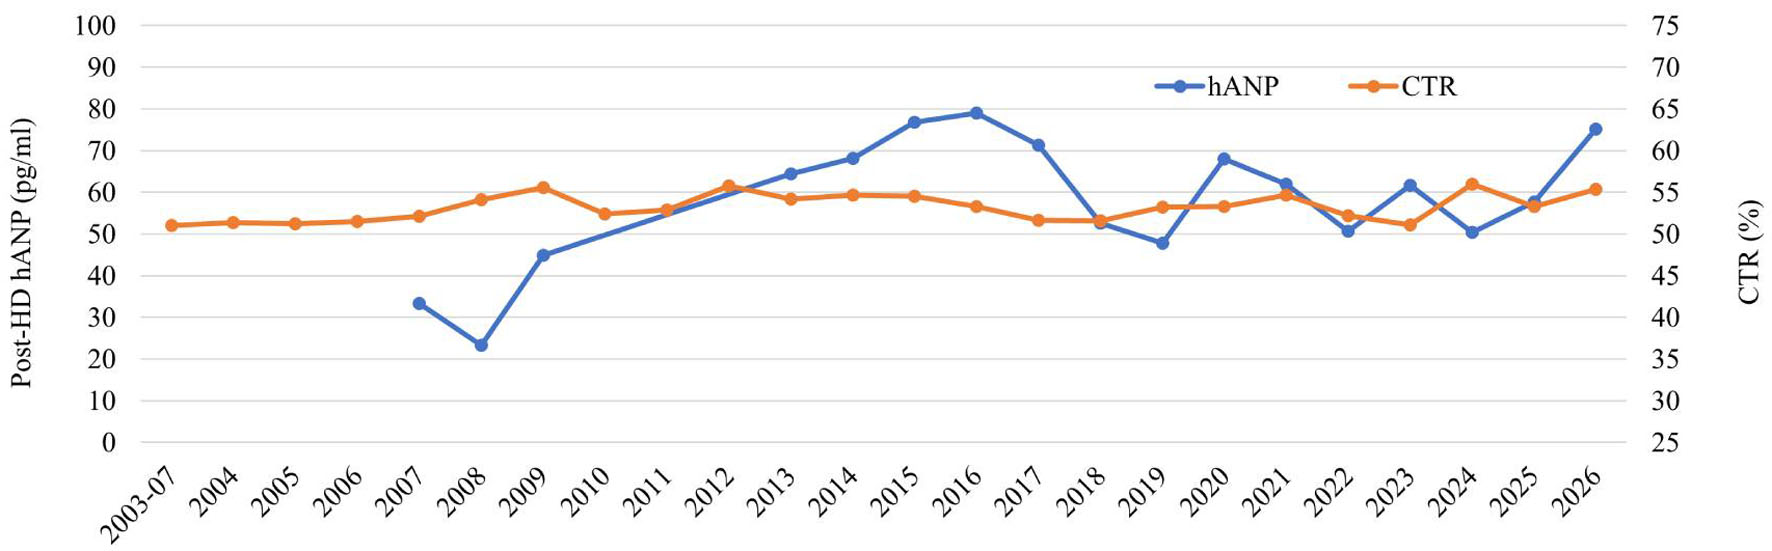
↓ Figure 4. Body fluid volume assessed by hANP and CTR. CTR: cardiothoracic ratio; hANP: human atrial natriuretic peptide; HD: hemodialysis.
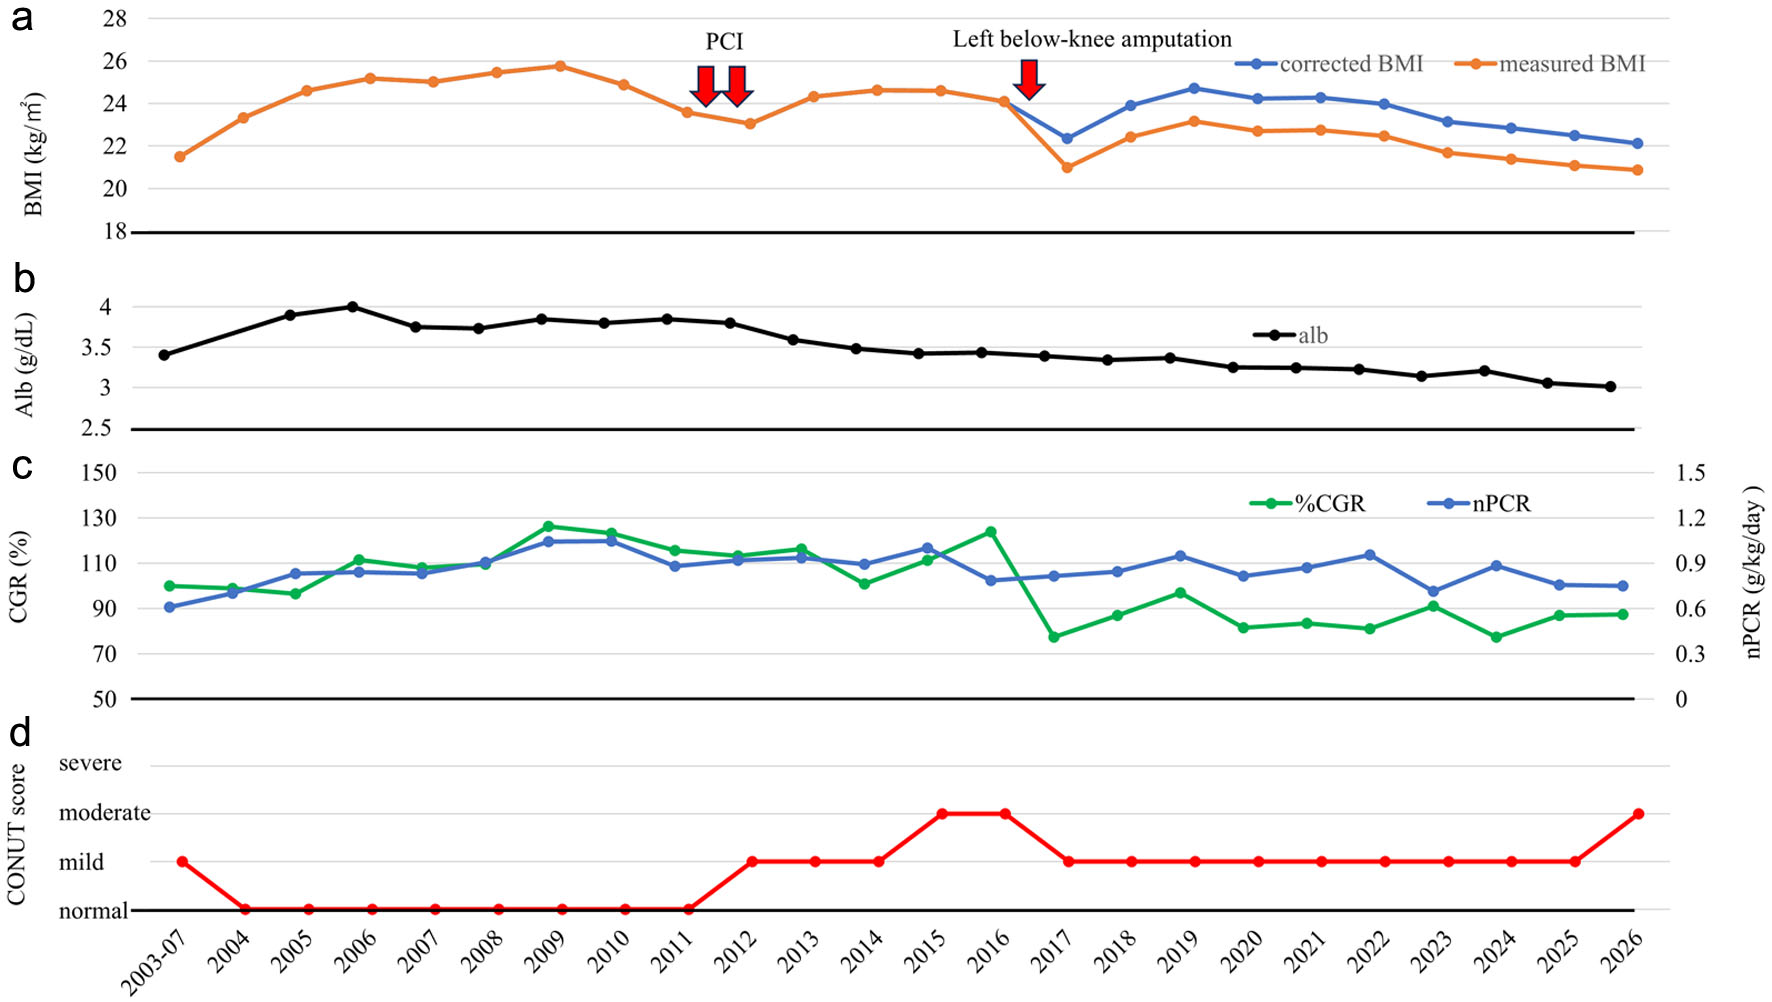
↓ Figure 5. Longitudinal changes in nutritional status. (a) Changes in BMI are shown in orange, and corrected BMI is shown in blue. (b) Changes in albumin levels. (c) Trends in CGR and nPCR. The left axis shows CGR, and the right axis shows nPCR. (d) Trends in CONUT score. The CONUT score is a nutritional index calculated from serum albumin, total cholesterol, and lymphocyte count that reflects protein metabolism, lipid metabolism, and immune function. Higher scores indicate more severe nutritional or immune impairment. In this figure, nutritional status is displayed using four categories: normal, mild, moderate, and severe impairment. Alb: albumin; BMI: body mass index; CGR: creatinine generation rate; CONUT: Controlling Nutritional Status; nPCR: normalized protein catabolic rate; PCI: percutaneous coronary intervention.
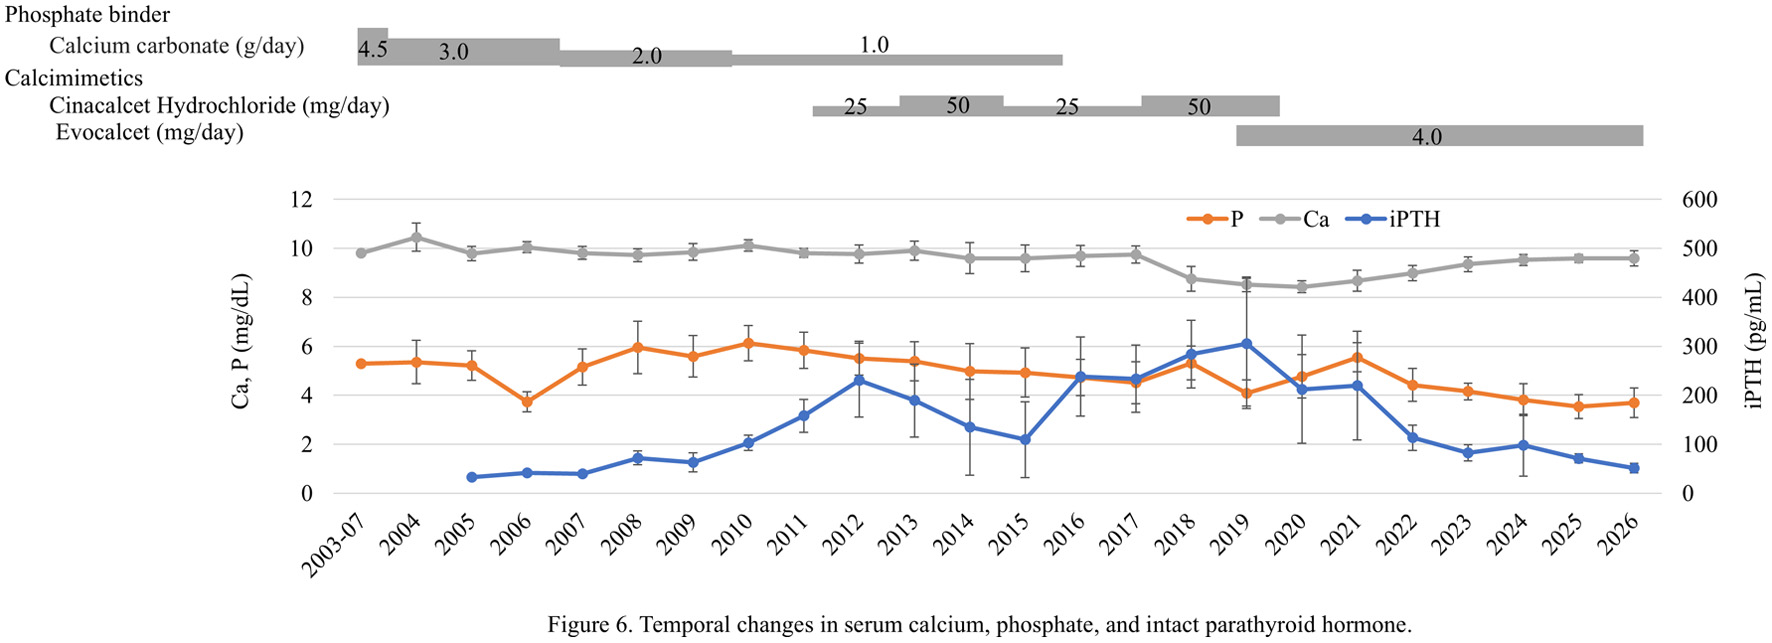
↓ Figure 6. Temporal changes in serum calcium, phosphate, and intact parathyroid hormone. Serum phosphate levels were initially managed with calcium carbonate, which was gradually tapered and eventually discontinued. Although iPTH levels rose on two occasions, calcimimetics effectively controlled these elevations. Ca: calcium; iPTH: intact parathyroid hormone; P: phosphate.
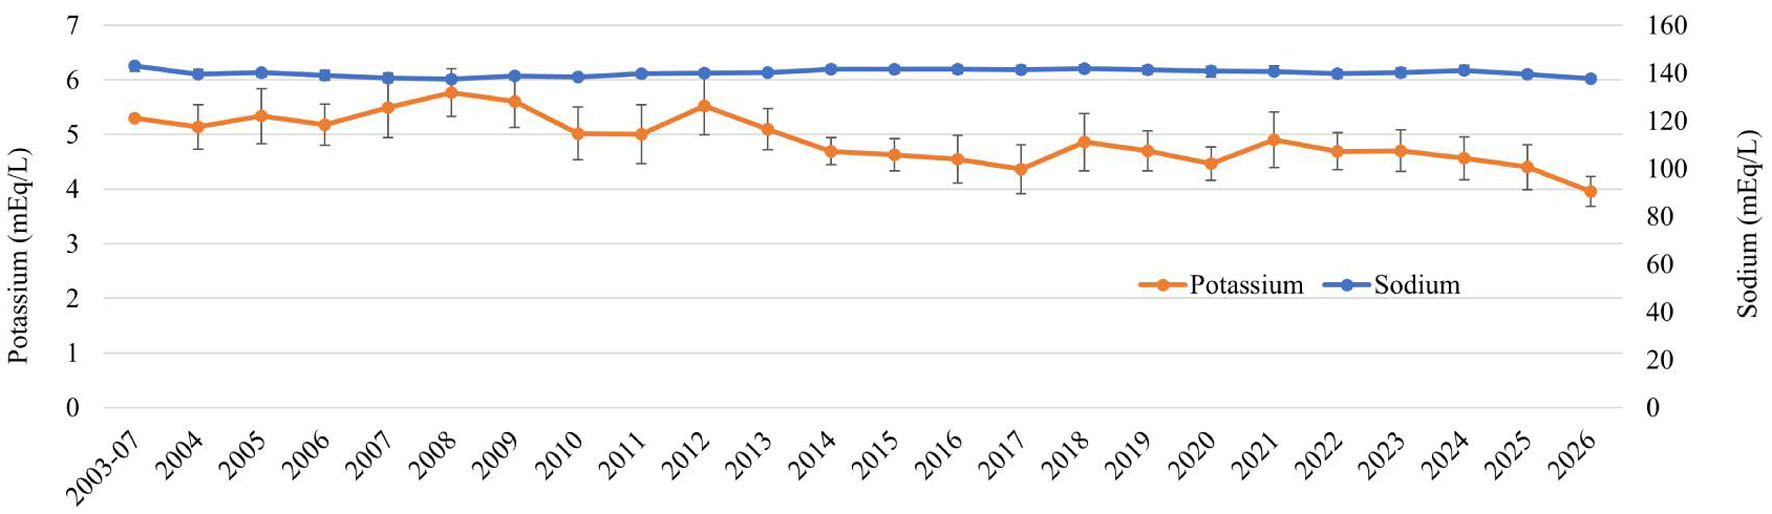
↓ Figure 7. Temporal changes in electrolytes: potassium and sodium. Potassium is shown on the left axis, and sodium on the right.
Tables
↓ Table 1. Average Laboratory Data for 23 Years After Transfer (July 2003 to June 2026)
| Laboratory value | Results | n | Frequency | Reference range |
|---|
| Data are expressed as mean ± standard deviation. Frequency: number of measurements per month (/M) or per year (/Y). β2MG: β2-microglobulin; HbA1c: hemoglobin A1c; HDL: high-density lipoprotein; iPTH: intact parathyroid hormone; LDL: low-density lipoprotein; UN: urea nitrogen. |
| White blood cell (/µL) | 5,731.5 ± 1,360.8 | 534 | 2/M | 4,000–8,000 |
| Red blood cell (× 104/µL) | 322.8 ± 26.9 | 534 | 2/M | 330–390 |
| Hemoglobin (g/dL) | 10.2 ± 0.9 | 534 | 2/M | 10.0–12.0 |
| HbA1c (%) | 6.0 ± 0.6 | 175 | 4−12/Y | |
| Glycated albumin (%) | 18.0 ± 1.7 | 155 | 1/M | < 20 |
| Total protein (g/dL) | 6.9 ± 0.5 | 64 | 3–6/Y | 6.5–8.3 |
| Albumin (g/dL) | 3.3 ± 0.3 | 237 | 2–12/Y | 3.5–5.0 |
| UN (mg/dL) | 54.5 ± 14.1 | 53 | 2/Y | |
| Creatinine (mg/dL) | 8.6 ± 1.2 | 53 | 2/Y | |
| β2MG (mg/L) | 25.5 ± 4.2 | 48 | 2/Y | < 30 |
| Triglyceride (mg/dL) | 124.2 ± 32.0 | 45 | 2/Y | 30–149 |
| Total cholesterol (mg/dL) | 168.8 ± 24.8 | 45 | 2/Y | < 180 |
| LDL-cholesterol (mg/dL) | 111.9 ± 24.5 | 45 | 2/Y | < 120 |
| HDL-cholesterol (mg/dL) | 39.8 ± 4.4 | 45 | 2/Y | > 40 |
| Sodium (mEq/L) | 140.1± 2.2 | 270 | 1/M | 136–147 |
| Potassium (mEq/L) | 4.9 ± 0.6 | 537 | 2/M | 3.6–5.0 |
| Calcium (mg/dL) | 8.9 ± 0.8 | 448 | 2/M | 8.4–10.0 |
| Phosphate (mg/dL) | 4.8 ± 1.0 | 448 | 2/M | 3.5–6.0 |
| iPTH (pg/mL) | 162.0 ± 109.1 | 205 | 3–12/Y | 60–240 |
| Alkaline phosphatase (U/L) | 166.7 ± 94.2 | 362 | 3–12/Y | 104–338 |
| Ferritin (ng/mL) | 89.0 ± 80.2 | 72 | 1–3/Y | 100–300 |
↓ Table 2. Average Hemodialysis Procedure Data for 23 Years After Transfer
| Results |
|---|
| AN69: acrylonitrile-sodium methallyl sulfonate copolymer membrane; Ca-P: calcium-phosphate; CGR: percentage creatinine generation rate; Glu: glucose; GNRI: Geriatric Nutritional Risk Index; nPCR: normalized protein catabolic rate; PES: polyethersulfone membrane; PS: polysulfone membrane; spKt/V: single-pool Kt/V. |
| Blood flow rate (mL/min) | 142.1 ± 17.6 |
| Dialysate flow rate (mL/min) | 300 |
| Dialysate composition (mEq/L) | Na+ = 140, K+ = 2.0, Ca++ = 3.0, Glu = 100 mg/dL |
| Dialysis membrane | PS, PES or AN69 |
| Membrane area (m2) | 1.04–1.6 |
| spKt/V | 1.76 ± 0.13 |
| standard Kt/V | 2.87 ± 0.25 |
| Ca-P product | 42.3 ± 10.6 |
| nPCR (g/kg/day) | 0.87 ± 0.13 |
| CGR (%) | 100.9 ± 17.1 |
| GNRI | 93.5 ± 5.0 |