Journal of Medical Cases, ISSN 1923-4155 print, 1923-4163 online, Open Access
Article copyright, the authors; Journal compilation copyright, J Med Cases and Elmer Press Inc
Journal website https://jmc.elmerpub.com

Case Report

Volume 17, Number 11, November 2026, pages 628-636


Reversible Thyroid Nodule in Van Wyk–Grumbach Syndrome: An Unusual Case Report

Figures

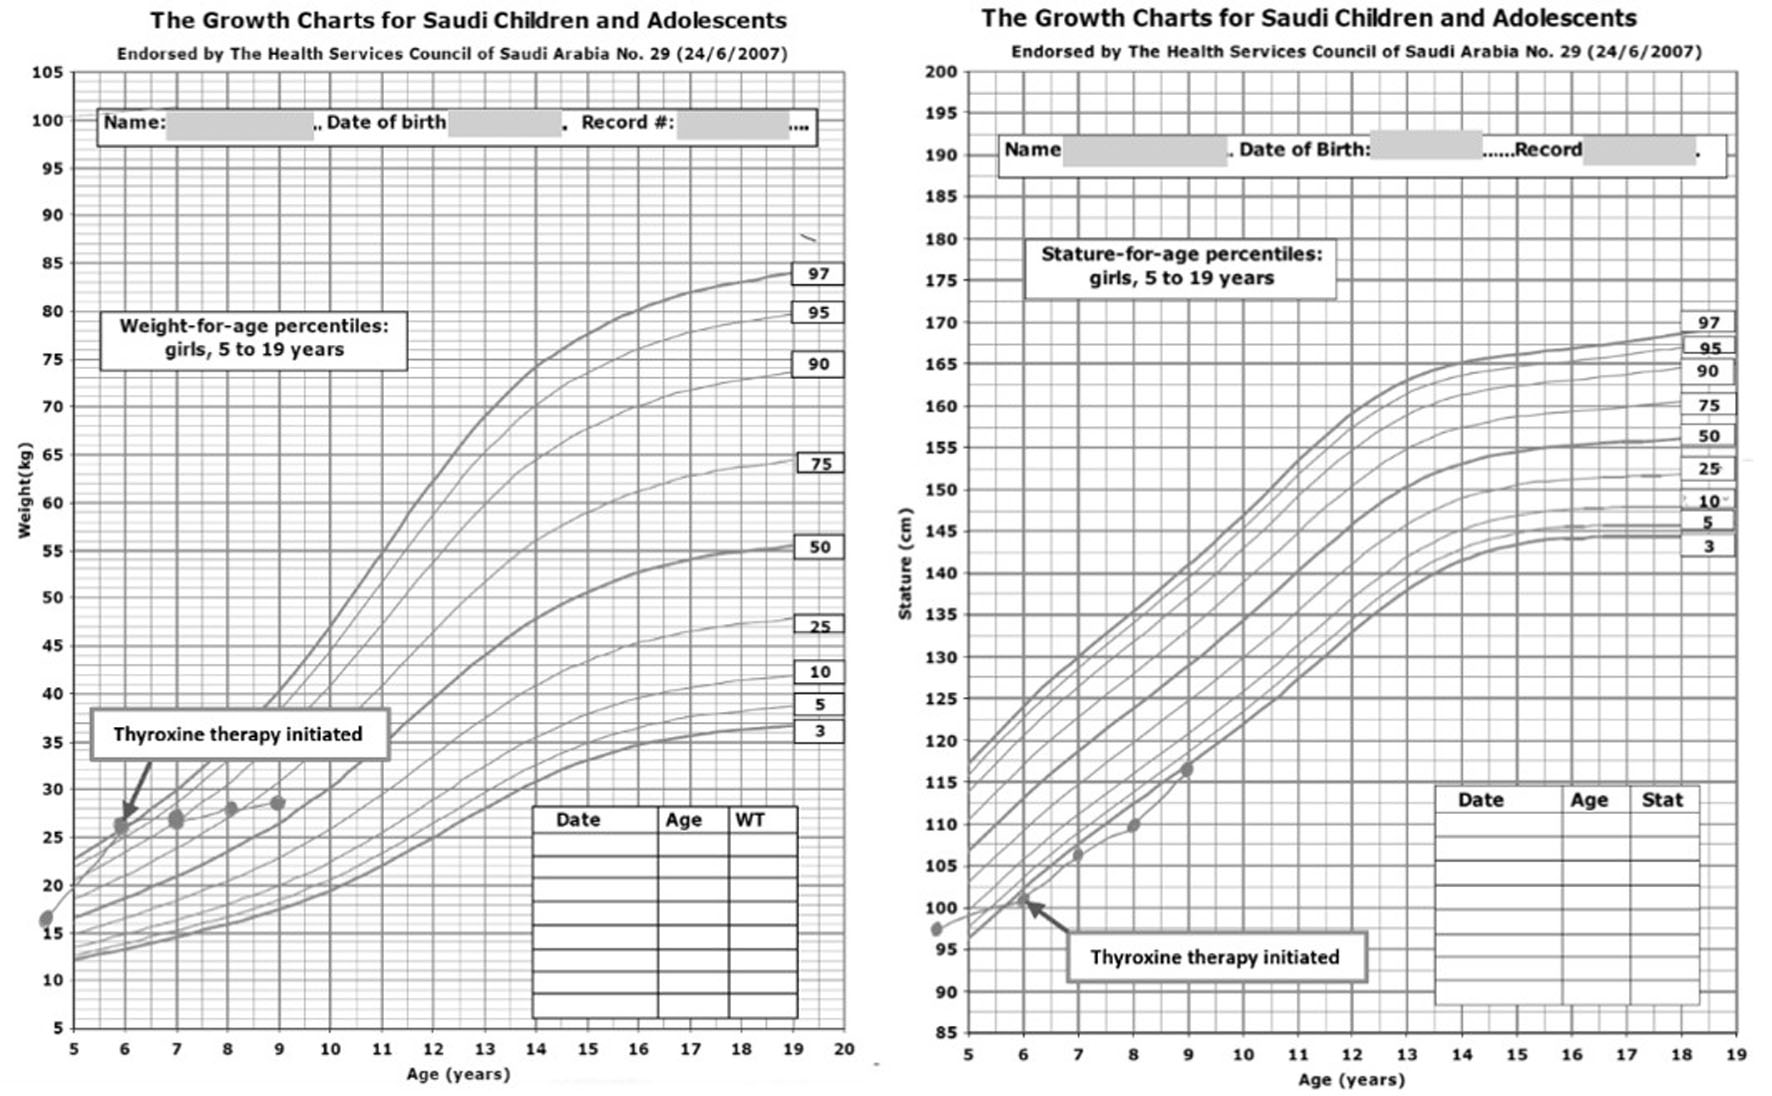
↓  Figure 1. Anthropometric measurements before and after levothyroxine therapy. Weight-for-age and height-for-age percentile charts for Saudi girls illustrating the patient’s growth trajectory at presentation. The plotted points indicate improvements in growth parameters before and after the initiation of levothyroxine therapy (arrow).
Figure 1.
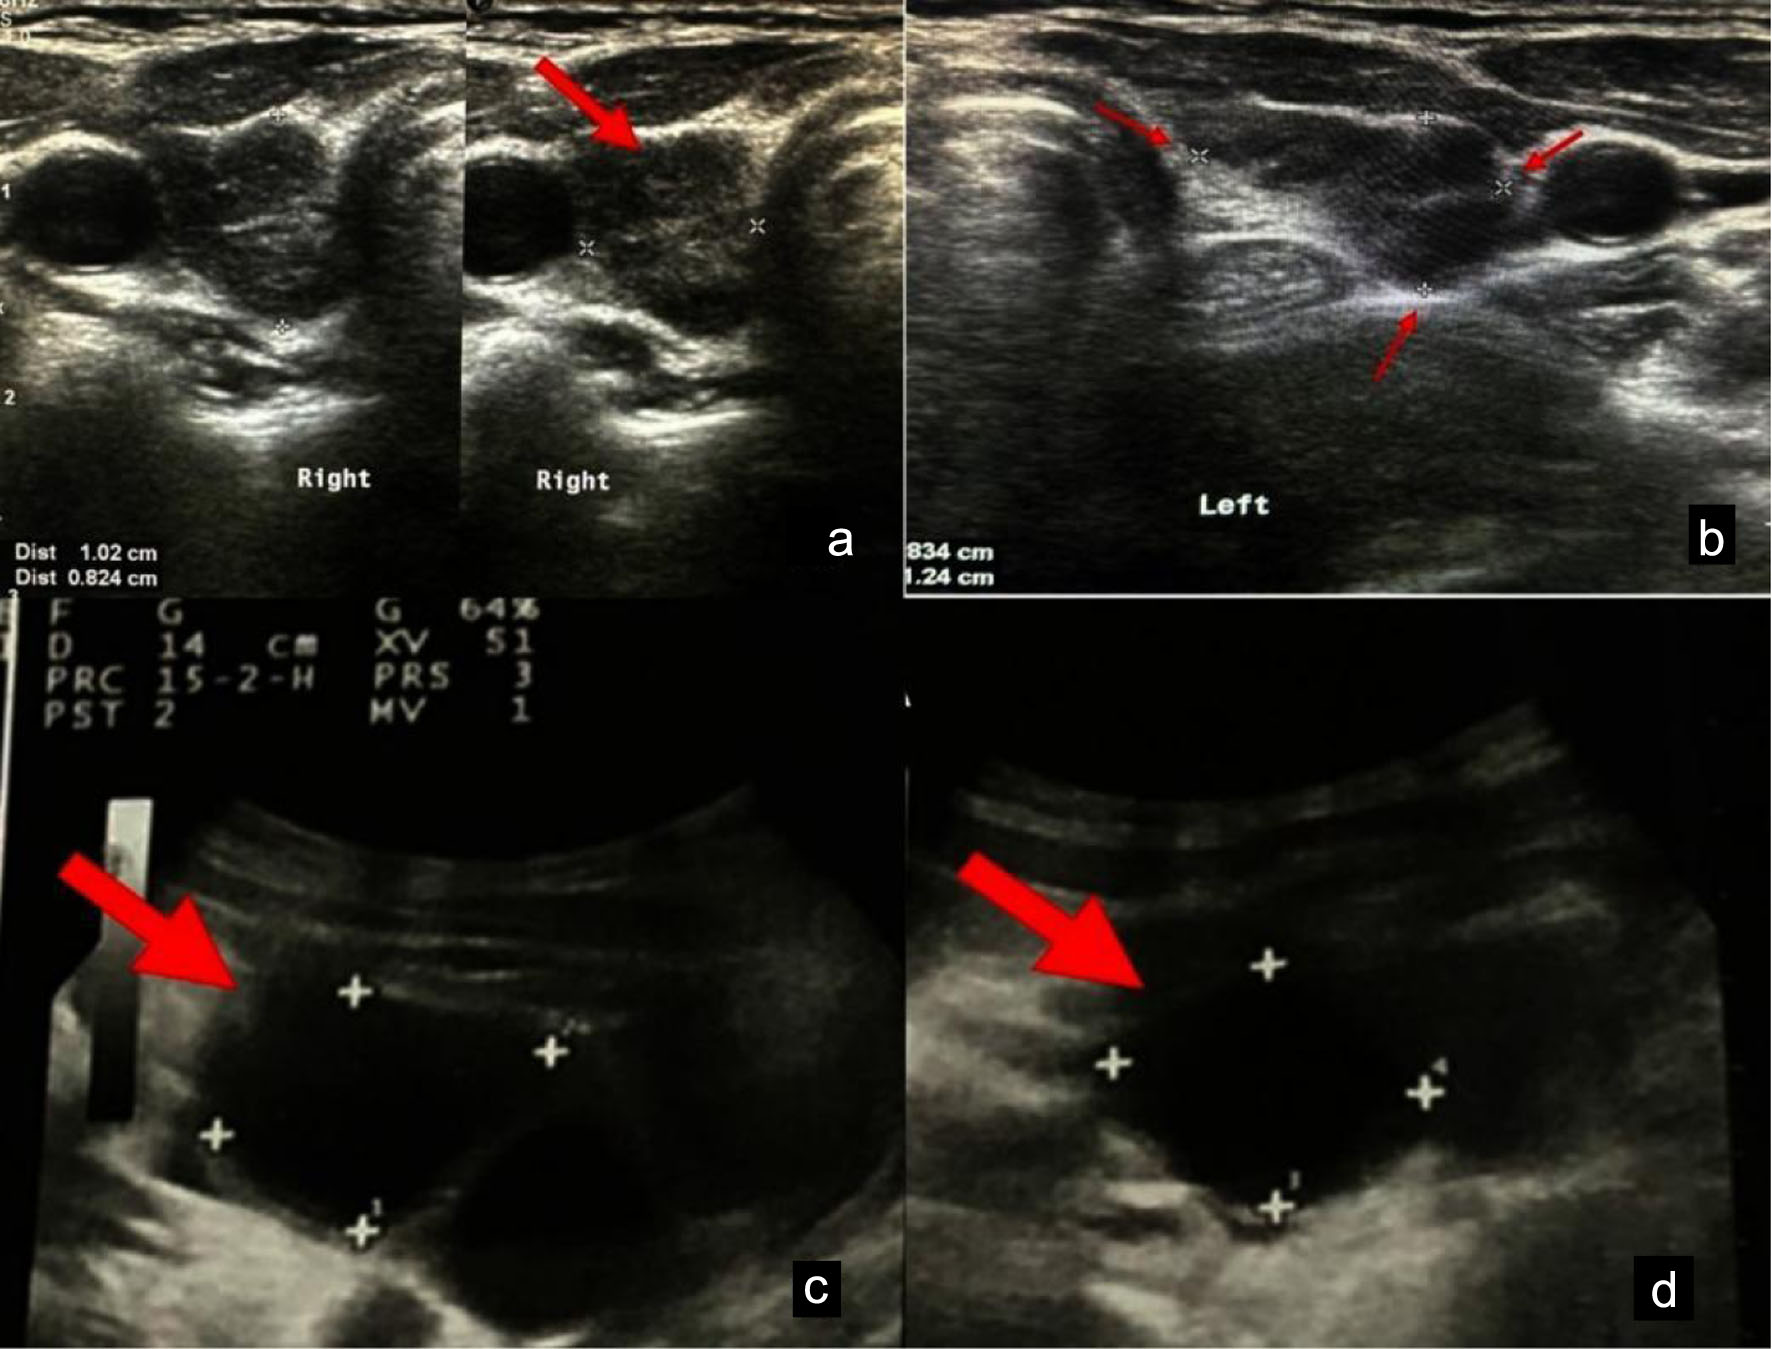
↓  Figure 2. Thyroid and pelvic ultrasound imaging. (a, b) Thyroid ultrasound demonstrates a hypoechoic nodule in the right lobe. (c, d) Pelvic ultrasound showing bilateral multi-cystic ovaries (arrows) consistent with Van Wyk-Grumbach syndrome and a prepubertal uterus in size and configuration.
Figure 2.
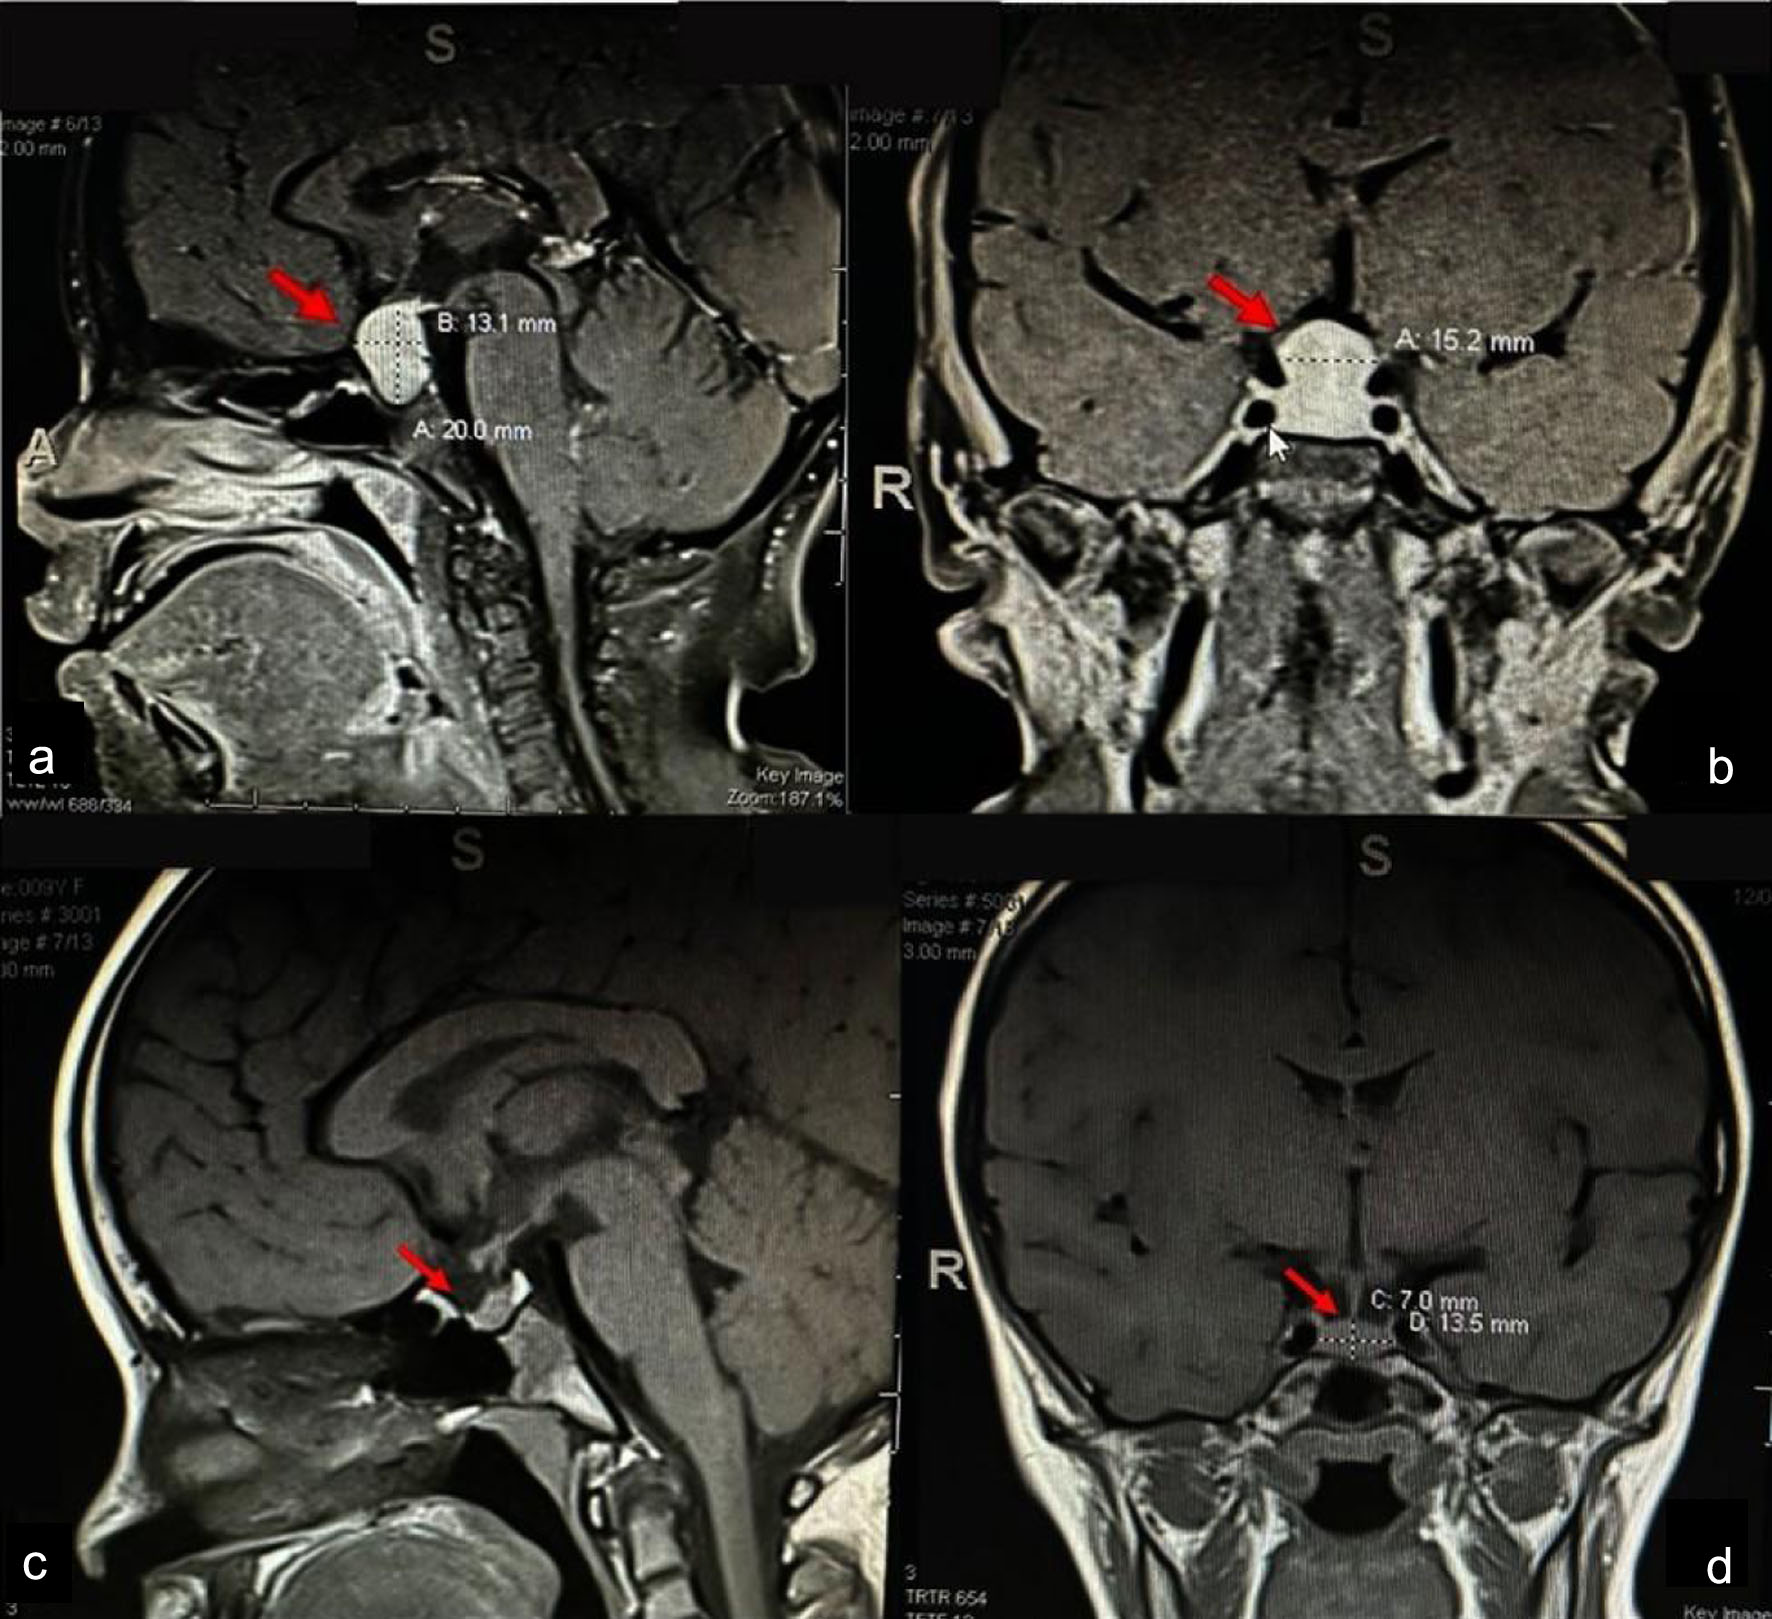
↓  Figure 3. Pituitary magnetic resonance imaging. (a, b) Baseline sagittal and coronal T1-weighted post-contrast images showing pituitary hyperplasia with suprasellar extension (arrows). (c, d) Follow-up imaging at 9 months demonstrated a marked reduction in pituitary size after levothyroxine therapy.
Figure 3.
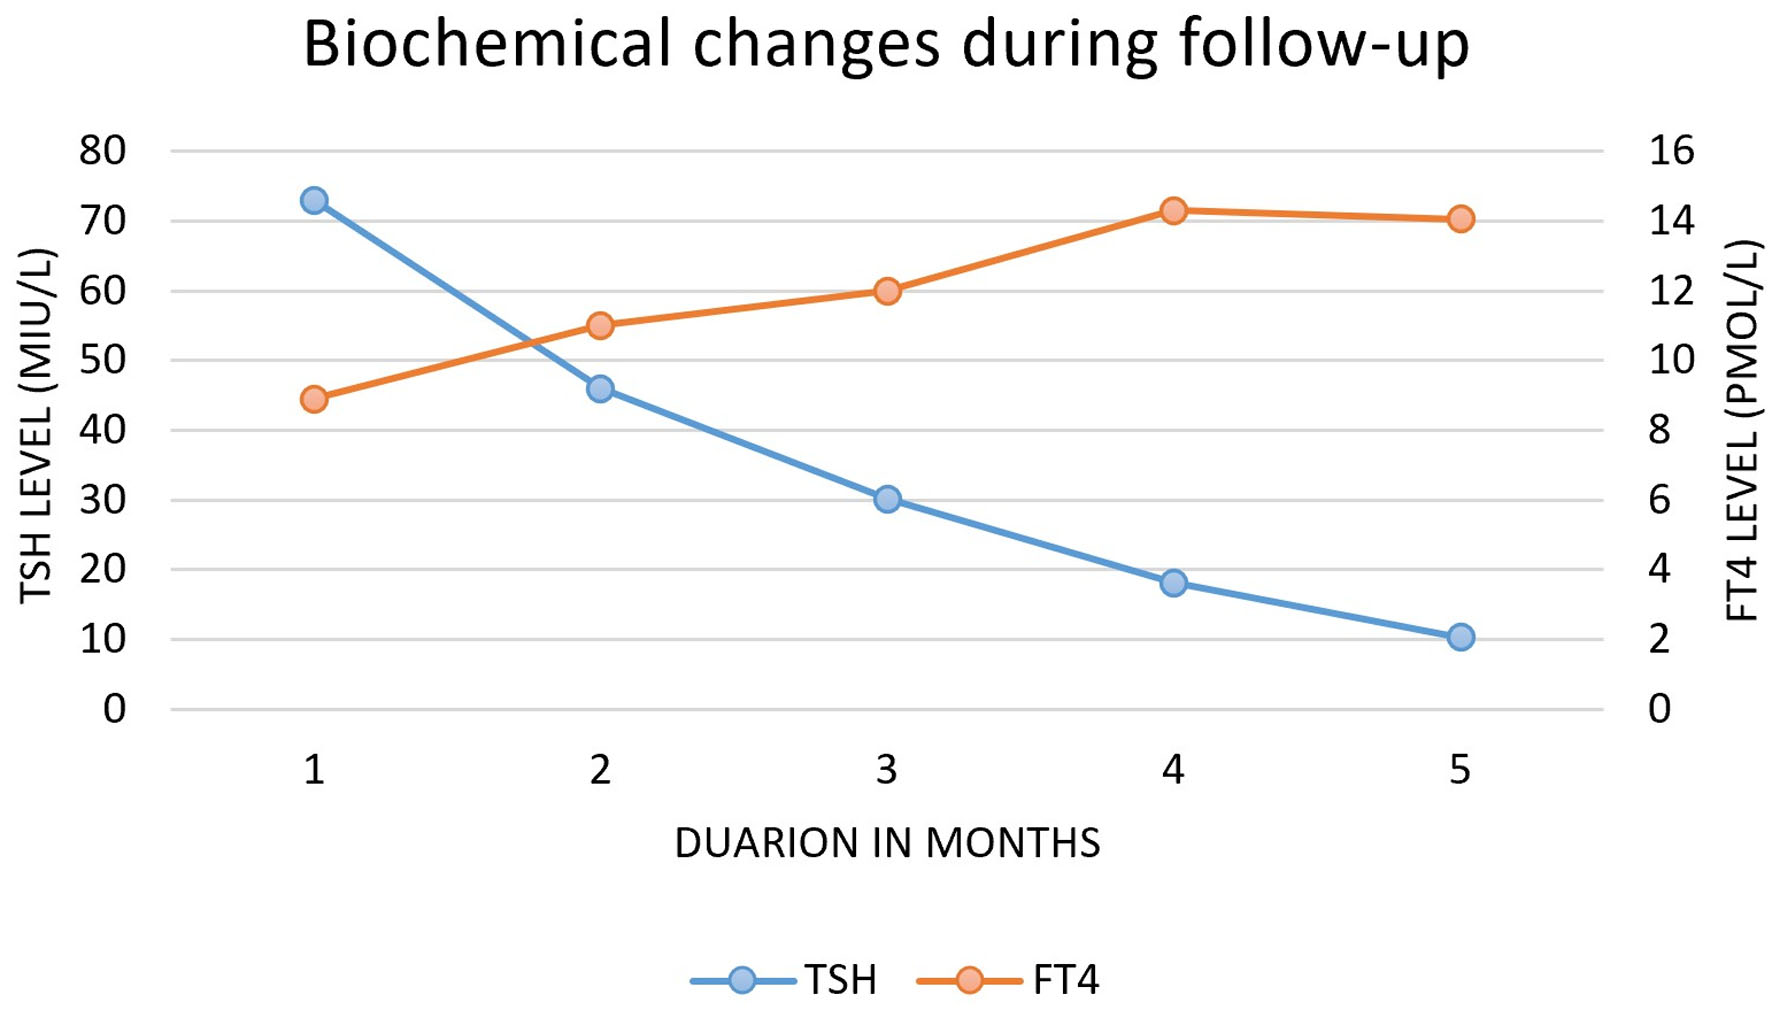
↓  Figure 4. Temporal changes in thyroid function tests during levothyroxine therapy. Serial measurements of thyroid-stimulating hormone (TSH) and free thyroxine (FT4) during follow-up after initiation of levothyroxine therapy. The graph demonstrates progressive normalization of thyroid function, with a marked decline in TSH levels accompanied by a corresponding increase in FT4 concentrations over the follow-up period.
Figure 4.

Tables

↓  Table 1. Baseline and Longitudinal Follow-Up Laboratory Parameters in Patients Diagnosed With Van Wyk–Grumbach Syndrome
 
ParameterAt diagnosis3 months6 months9 monthsReference rangeInterpretation
Anti-TG: anti-thyroglobulin antibodies; Anti-TPO: anti-thyroid peroxidase antibodies; DHEA-S: dehydroepiandrosterone sulfate; FSH; follicle-stimulating hormone; FT4: free thyroxine; FT3: free triiodothyronine; IGF-1: insulin-like growth factor-1; IGFBP-3: insulin-like growth factor-binding protein-3; LH: luteinizing hormone; MCH: mean corpuscular hemoglobin; MCHC: mean corpuscular hemoglobin concentration; MCV: mean corpuscular volume; RDW: red cell distribution width; TSH: thyroid-stimulating hormone.
Hematology
  Hemoglobin (g/dL)10.611.812.212.411.5–14.5Macrocytic hyperchromic anemia at baseline, normalized with treatment.
  MCV (fL)95.484.282.181.575–87Elevated at baseline, normalized
  MCH (pg)30.927.826.926.224–30
  MCHC (g/dL)32.333.132.832.631–35Normal throughout
  RDW (%)13.713.212.912.811.6–14
Thyroid function
  TSH (mIU/L)> 754.22.11.80.25–5Markedly elevated at baseline, normalized by 3 months.
  FT4 (pmol/L)9.118.317.116.813.9–22.1Low at baseline, normalized by 3 months
  FT3 (pmol/L)3.45.25.04.93.8–8.6
Thyroid autoantibodies
  Anti-TG (U/mL)161.7--115.2< 15Positive, gradually declining
  Anti-TPO (U/mL)190.1--138.7< 15
Reproductive hormones
  LH (IU/L)< 0.21< 0.210.320.451.3–1.4Prepubertal at baseline, gradually increasing
  FSH (U/L)7.013.212.452.121.9–2.3Elevated at baseline, normalized
  Prolactin (ng/mL)1732818144.0–25Markedly elevated at baseline, normalized by 3 months
  Estradiol (pg/mL)82352218Up to 27Elevated at baseline, normalized
  Progesterone (ng/mL)0.040.050.060.05< 0.35Normal throughout
  DHEA-S (µg/dL)10.312.114.516.854.4–254.0Low, gradually increasing with age
Growth Factors
  IGF-1 (ng/mL)9811212814588–246Normal, increasing with treatment
  IGFBP-3 (µg/mL)2.83.23.53.82.1–5.2


↓  Table 2. Reported Thyroid Morphological and Structural Abnormalities Documented in Published Pediatric Cases of Van Wyk–Grumbach Syndrome
 
YearAuthorStudy type (N)Thyroid imaging findingsThyroid noduleRef.
“-” indicates that no thyroid nodule was reported. FT4: free thyroxine; NR: not reported; TSH: thyroid-stimulating hormone; US: ultrasound; VWGS: Van Wyk–Grumbach syndrome.
2007Sanjeevaiah et alCase reportNR-[15]
2012Baranowski et alCase reportNR-[9]
2012Patni et alCase report + reviewNR-[16]
2015Bhagwat et alCase reportNR-[17]
2016Kocova et alCase series (8)NR-[18]
2018Leonardi et alCase reportEnlarged gland with heterogeneous echotexture-[19]
2018Reddy et alCase reportNR-[20]
2020Lee et alCase reportDecreased thyroid volume on ultrasound-[21]
2020Gupta et alCase reportNR-[22]
2020Riaz et alCase series (10)Radiologic profile described; thyroid details not reported-[23]
2022Kandasamy et alCase reportUS performed; morphology not detailed-[24]
2023Kusuma Boddu et alCohort (30)Goiter variably reported; structural imaging not detailed-[13]
2023Sherwani et alCase reportImaging focused on VWGS; thyroid morphology not detailed-[25]
2023Waddankeri et alCase series (3)NR-[26]
2023Marzouk et alCase reportUS and scintigraphy suggest thyroiditis-[27]
2024Nicolescu et alCase series (2)Moderate goiter on US in one patient-[14]
2024Rathod et alCase reportNR-[28]
2024Baioumi et alCase reportNR-[29]
2024Mukhopadhyay et alCase series (3)NR-[30]
2025Ganta et alCase reportNR-[31]
2025Sivasubramanian et alCase reportNR-[32]
2025Gil et alCase reportNR-[33]
2026Cao et alCase reportNR-[12]