Figures
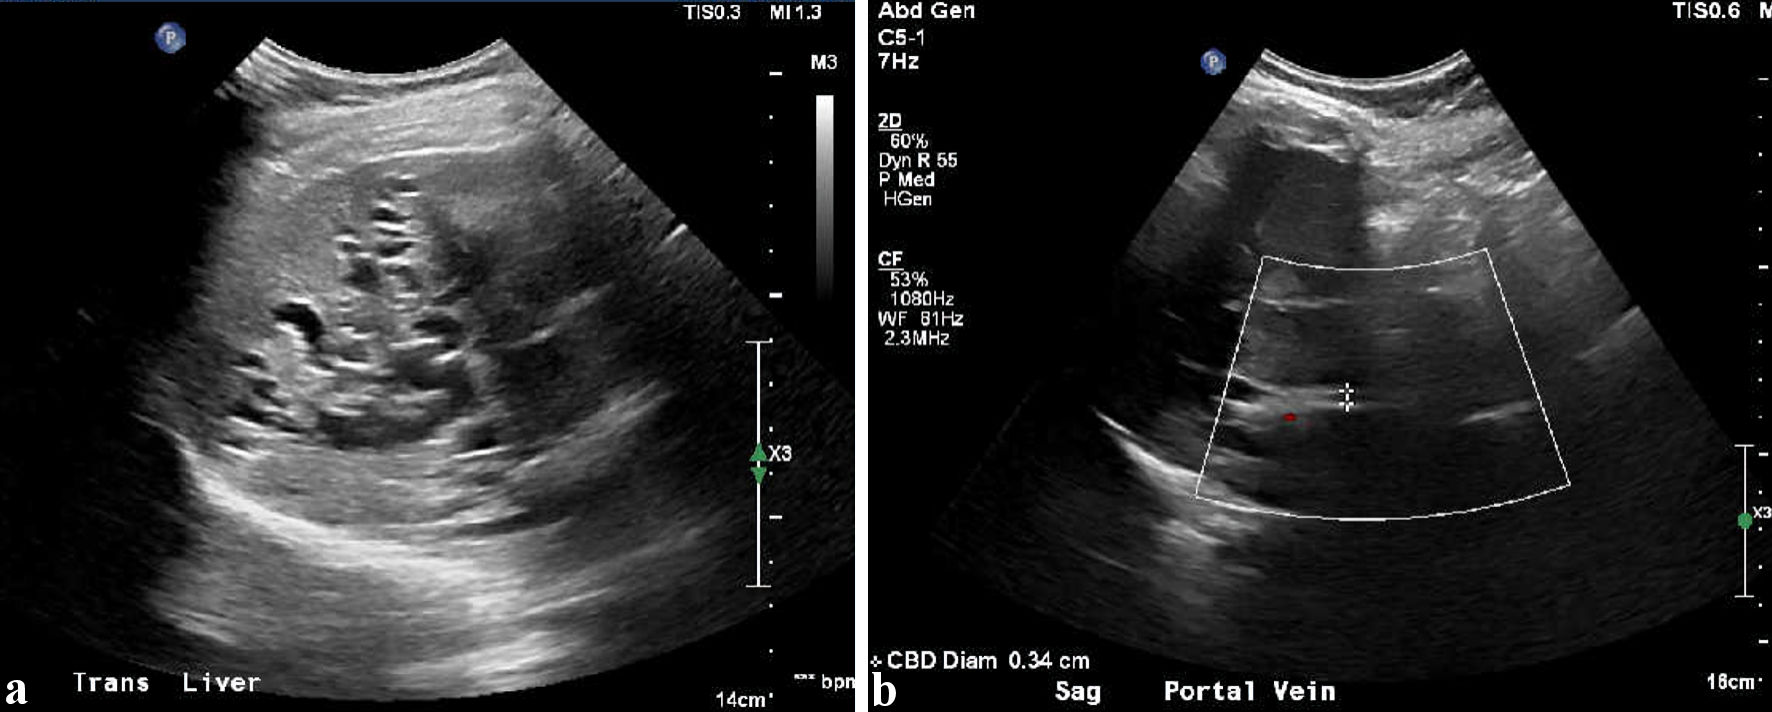
↓ Figure 1. Ultrasound complete abdomen, showing (a) multiple cystic dilations in the liver and (b) common bile duct measuring 0.34 cm.
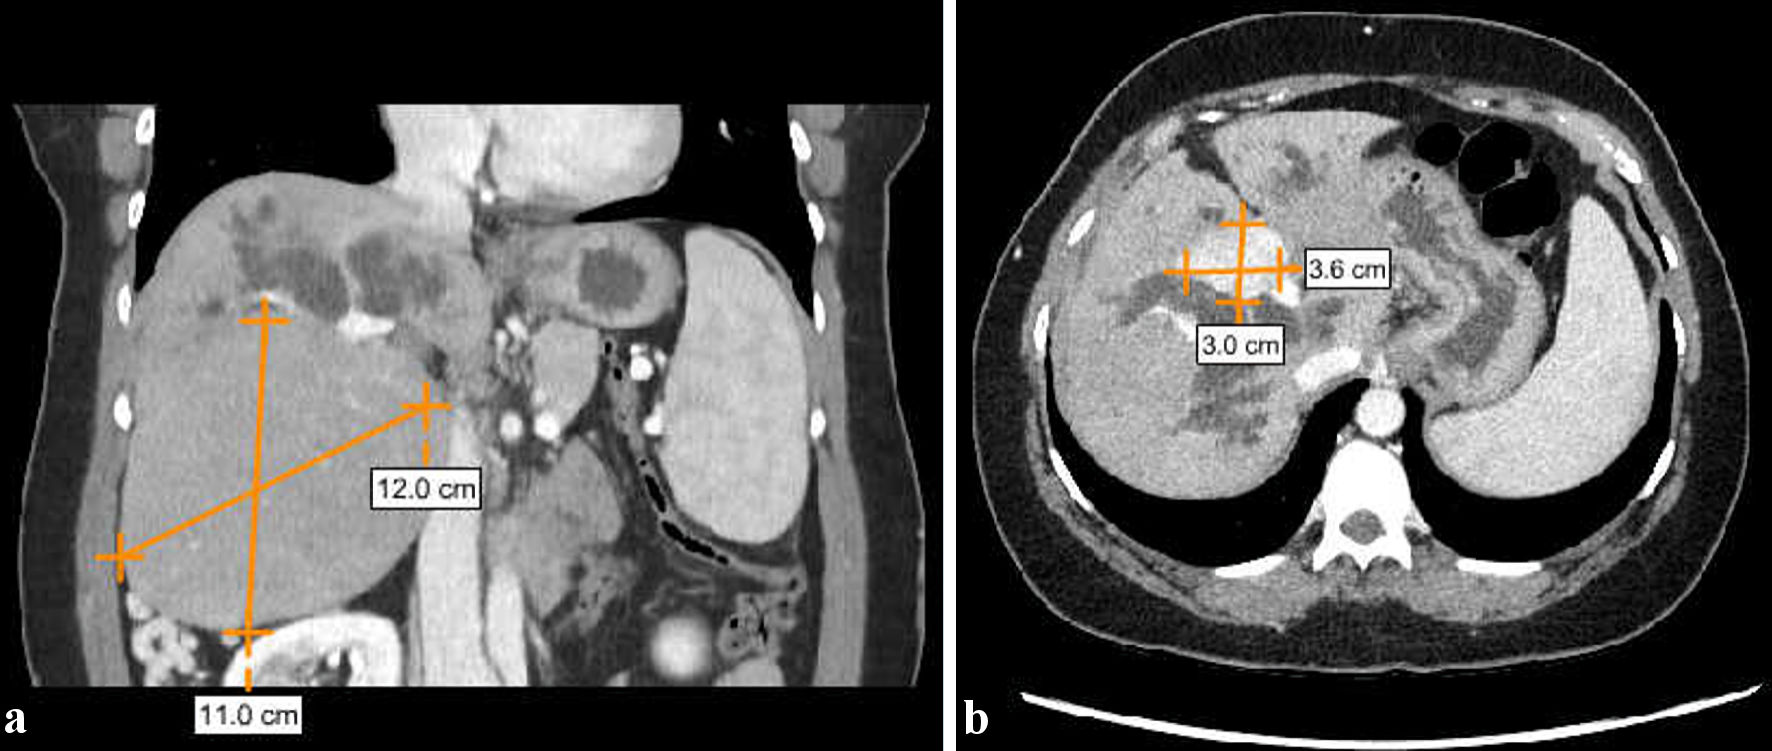
↓ Figure 2. CT abdomen–pelvis with intravenous (IV) contrast enhancing, showing (a) markedly hypertrophied segment extending inferiorly from the liver (12 × 11 cm) and (b) a 3.6 × 3.0 cm tubular arterially enhancing structure anterior to the main portal vein. CT: computed tomography.
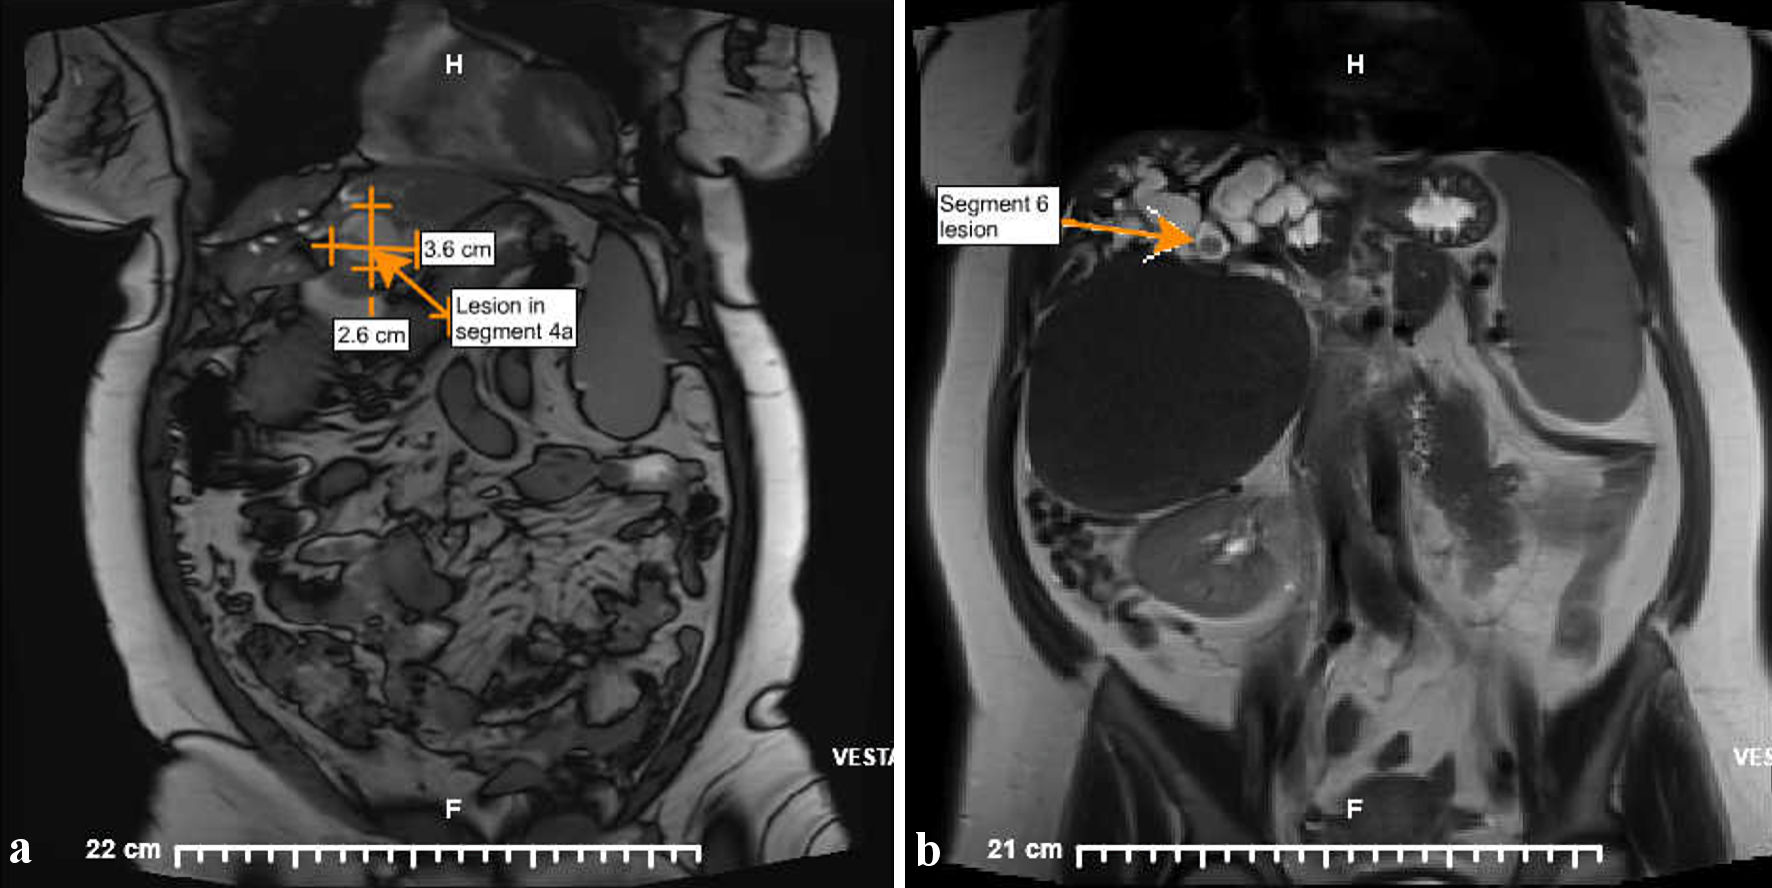
↓ Figure 3. Magnetic resonance imaging with gadolinium of abdomen–pelvis, showing (a) an arterially enhancing lesion measuring 3.6 × 2.6 cm in segment 4a and (b) a second exophytic lesion arising from segment 6 which demonstrated different signal characteristics.
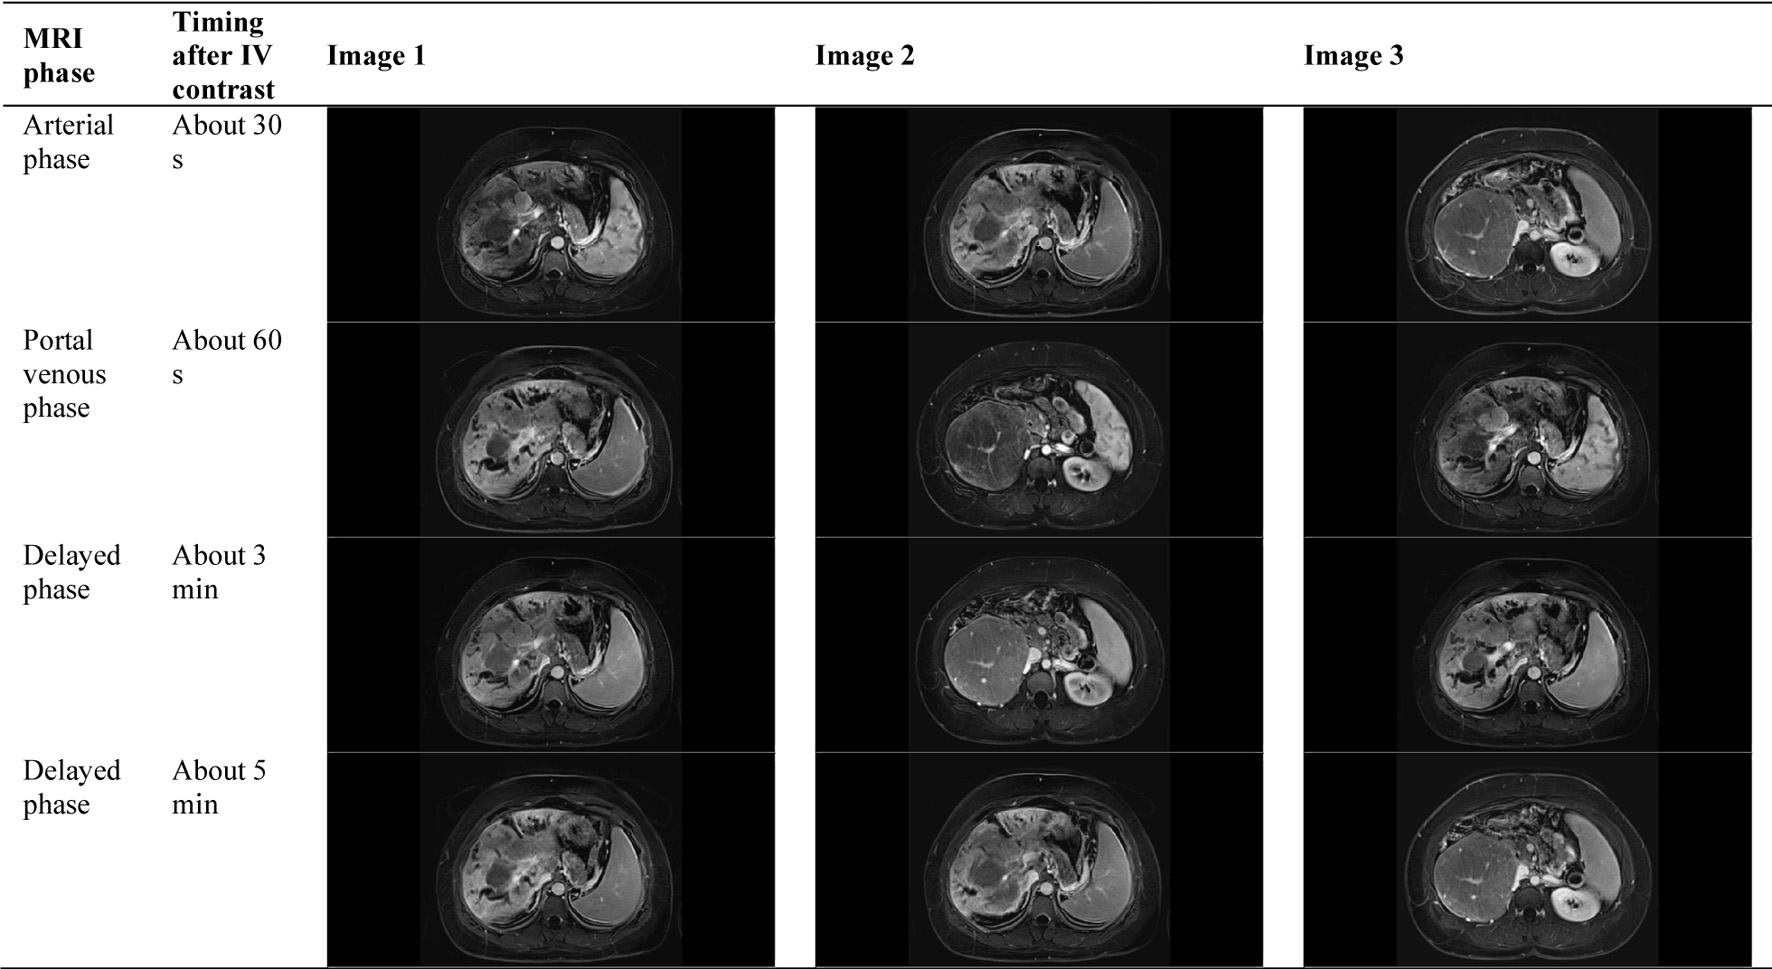
↓ Figure 4. Triphasic Contrast-Enhanced MRI of the Liver Demonstrating Enhancement Characteristics of FNH With Patent Arterial/Venous Flow Through All Phases of Scan. MRI: magnetic resonance imaging; FNH: focal nodular hyperplasia; IV: intravenous.
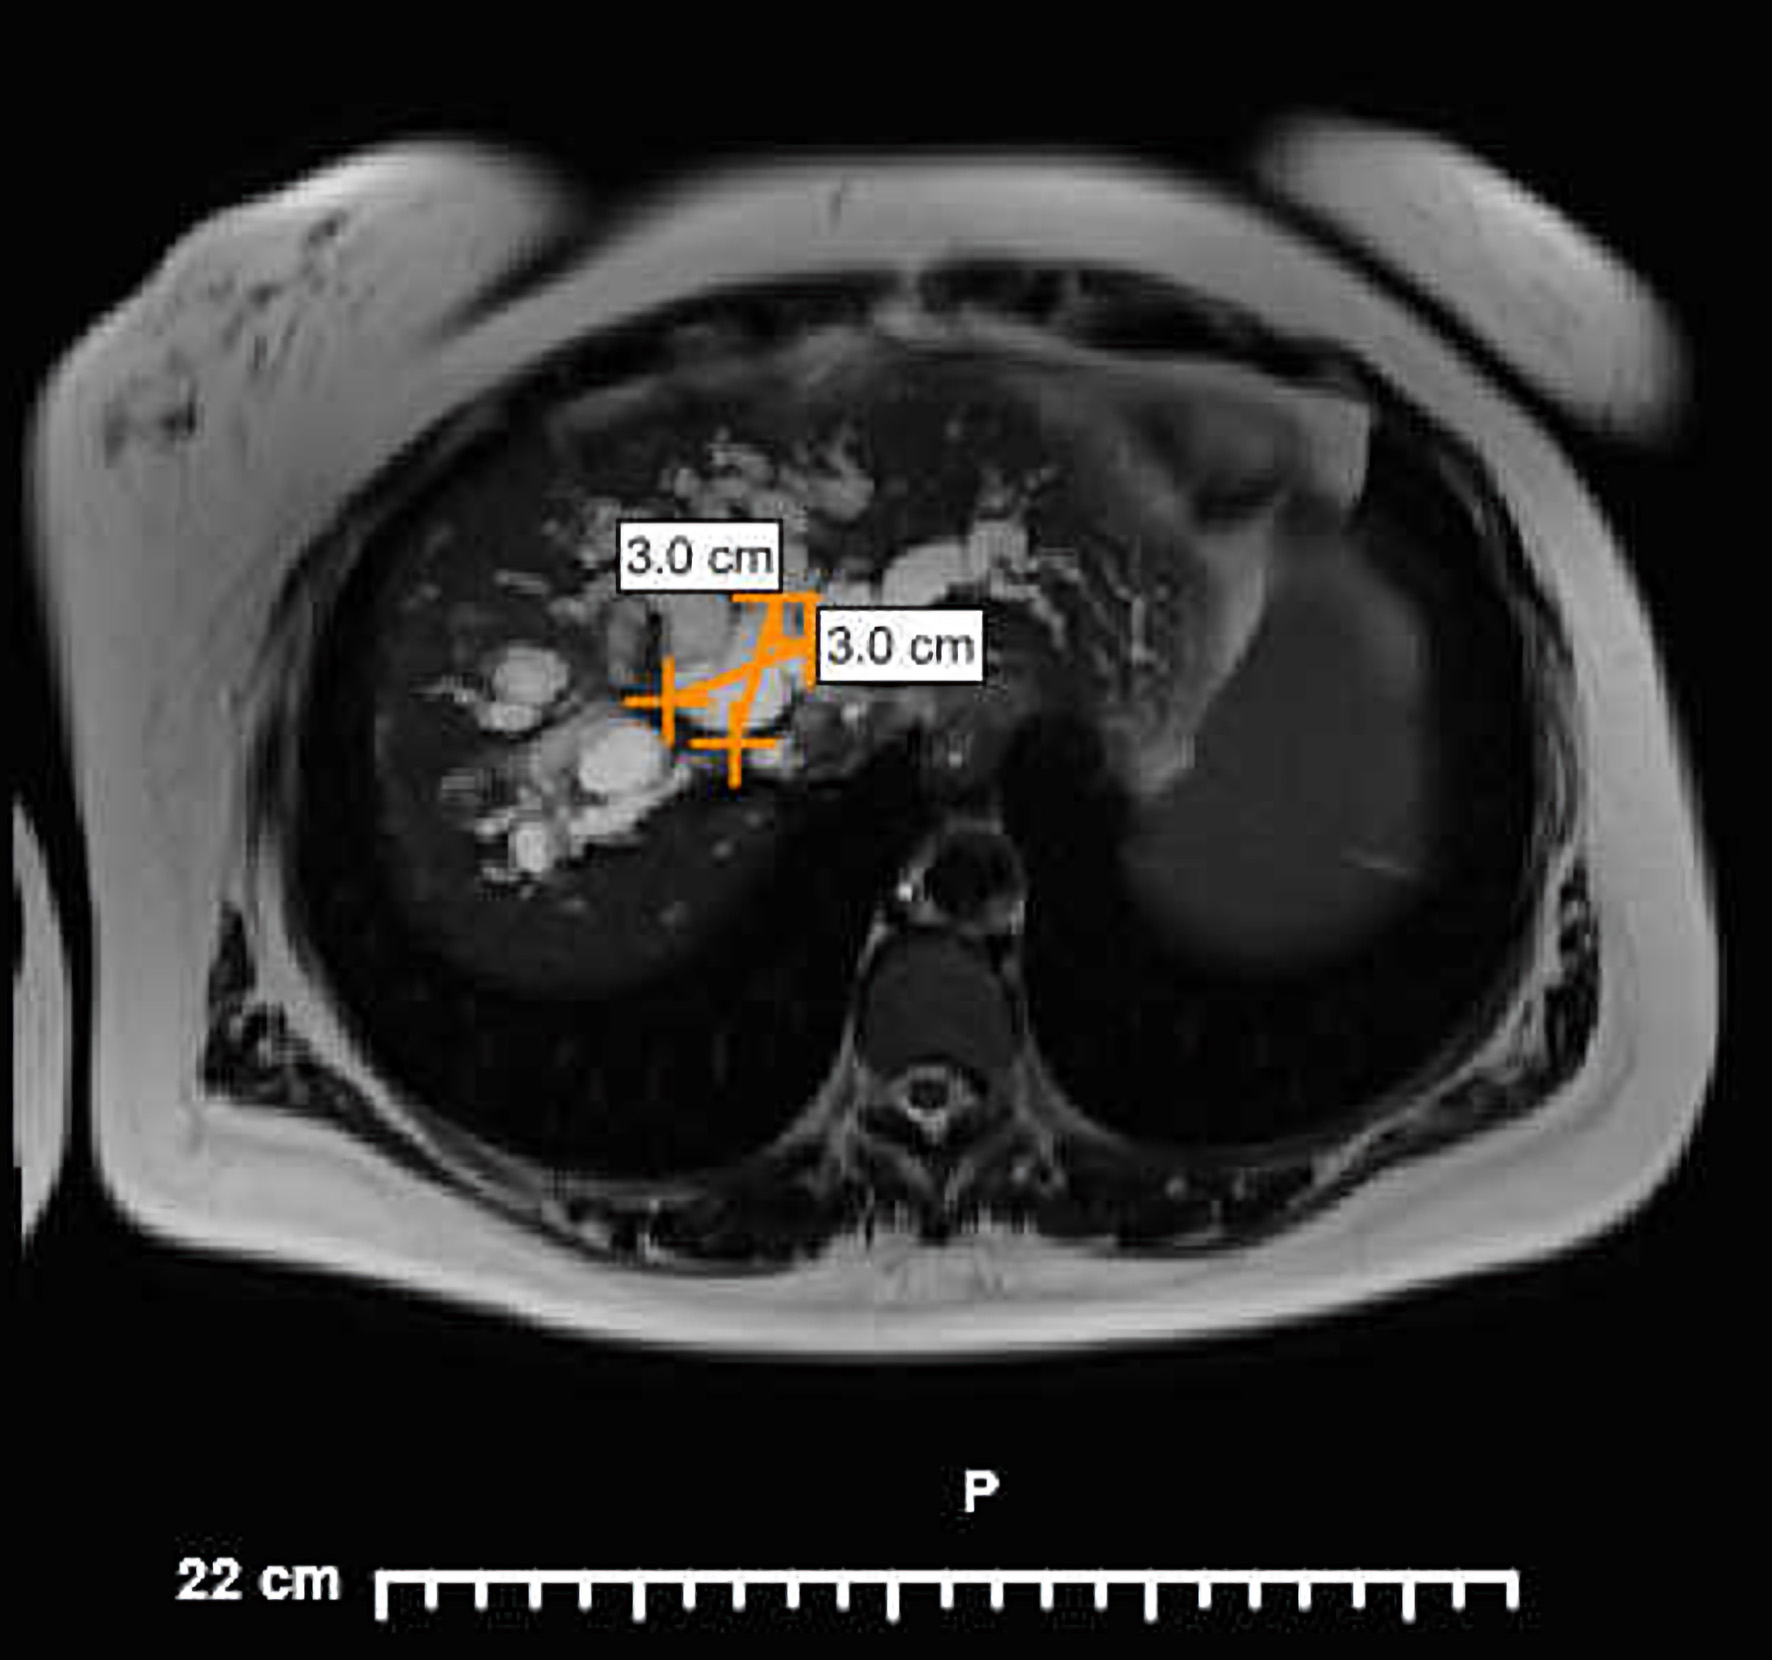
↓ Figure 5. Magnetic resonance imaging with gadolinium of abdomen–pelvis, showing a lobulated arterially enhancing solid mass measuring 4.3 × 3.0 × 3.0 cm.
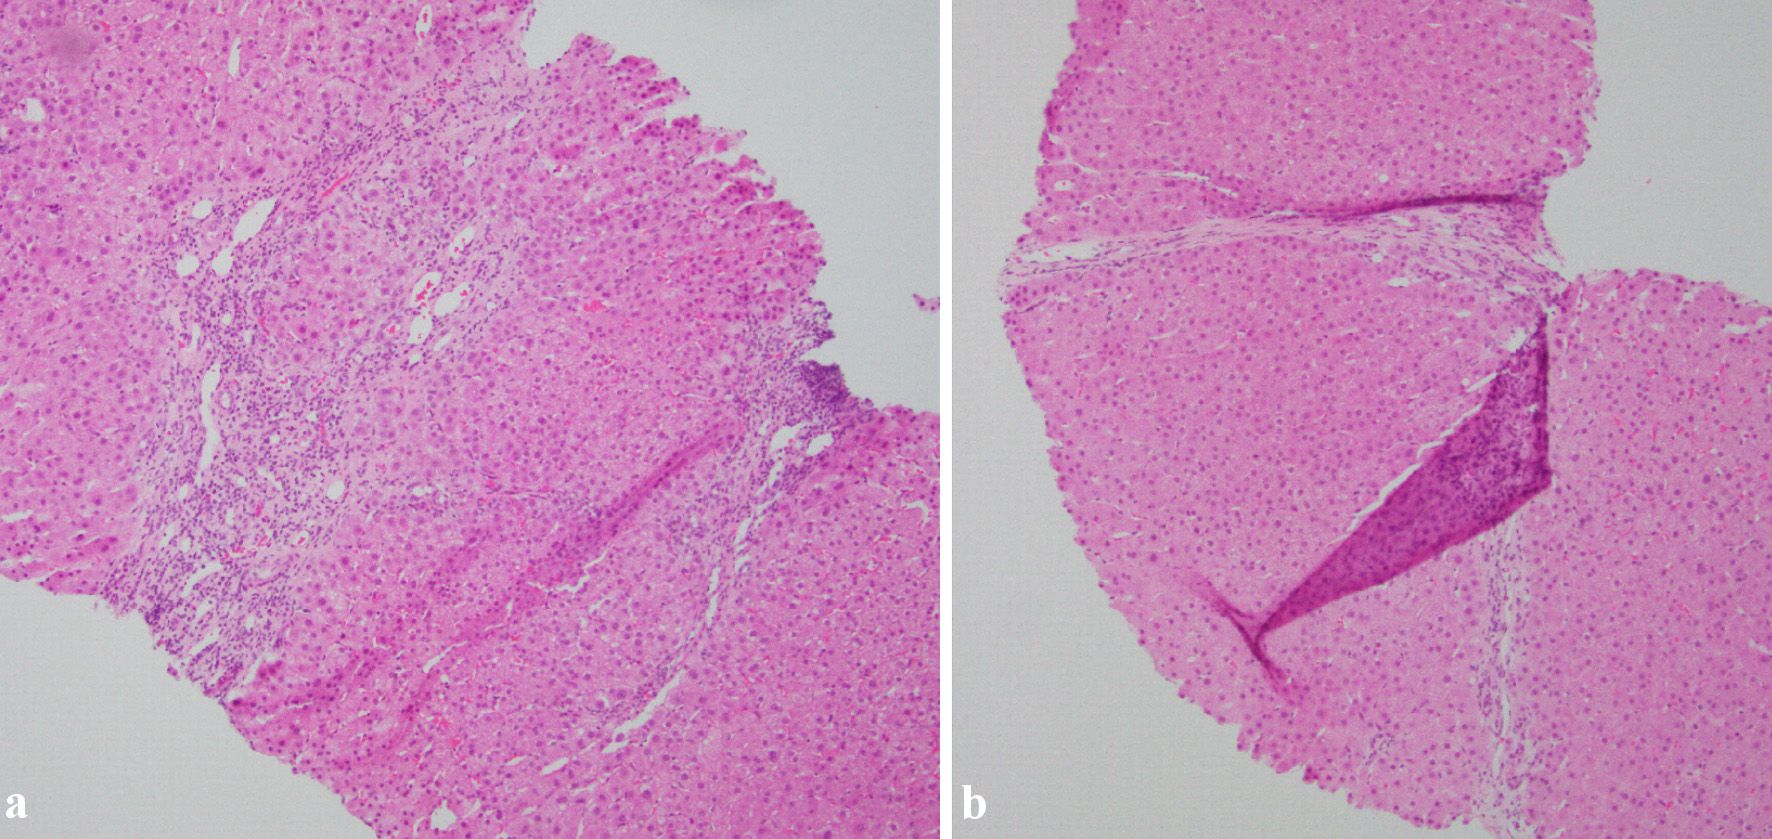
↓ Figure 6. The two pictures, taken at × 10 magnification showing a nodule formed by a thin fibrous band. The fibrous septa also contain a bile ductular reaction and inflammatory cell infiltrates.
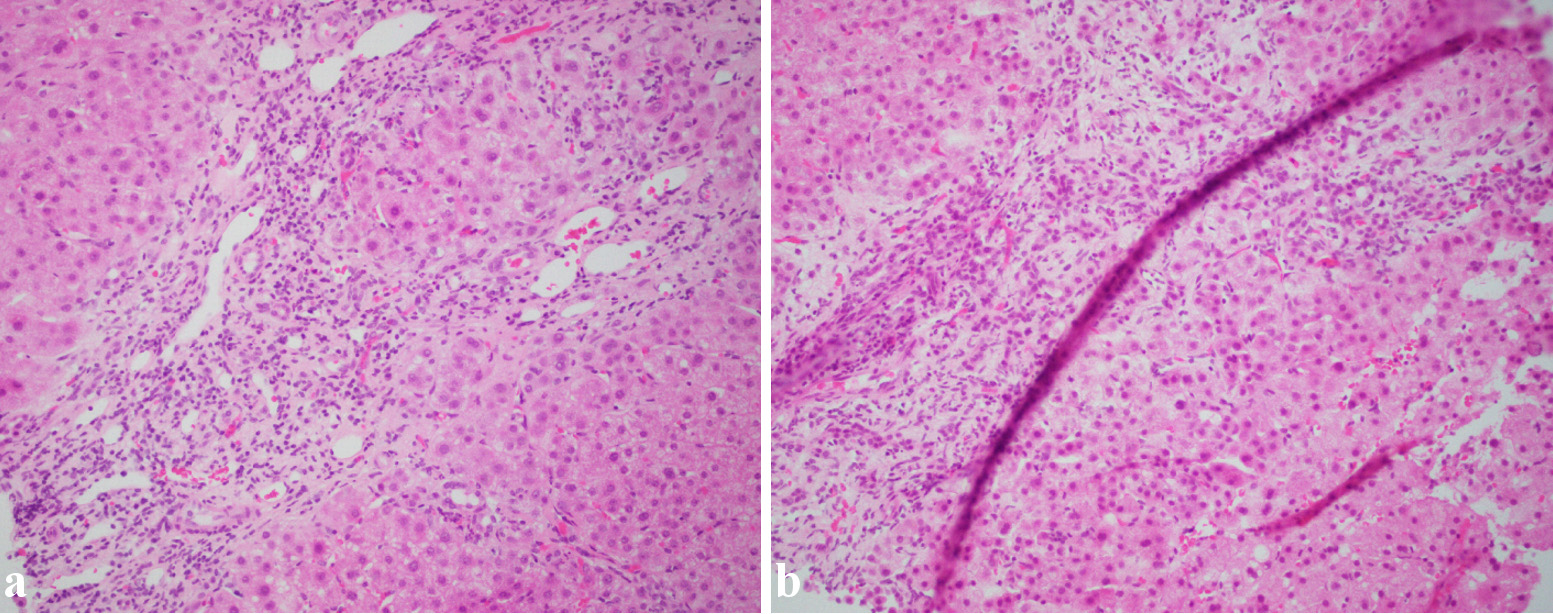
↓ Figure 7. Two pictures showing (a) a fibrous band with abnormally dilated vessels and chronic inflammation and (b) a fibrous band with ductular reaction and chronic inflammation.
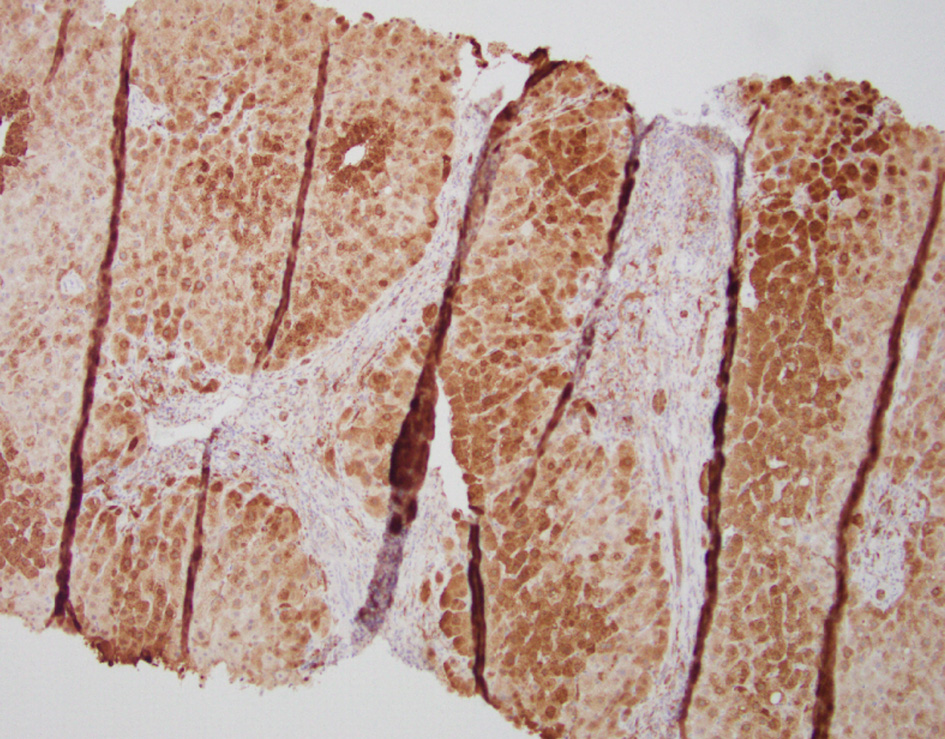
↓ Figure 8. Glutamine synthetase immunostaining demonstrating a strong, patchy, map-like pattern.