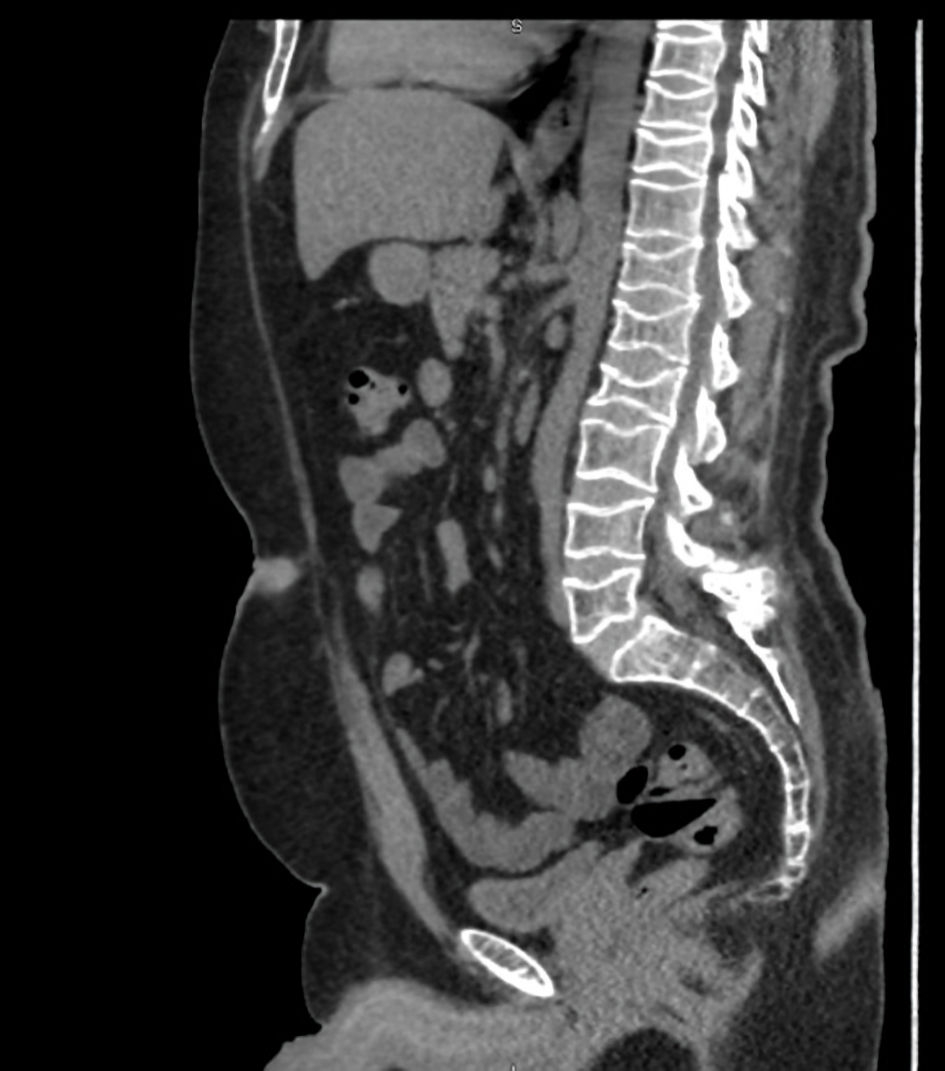
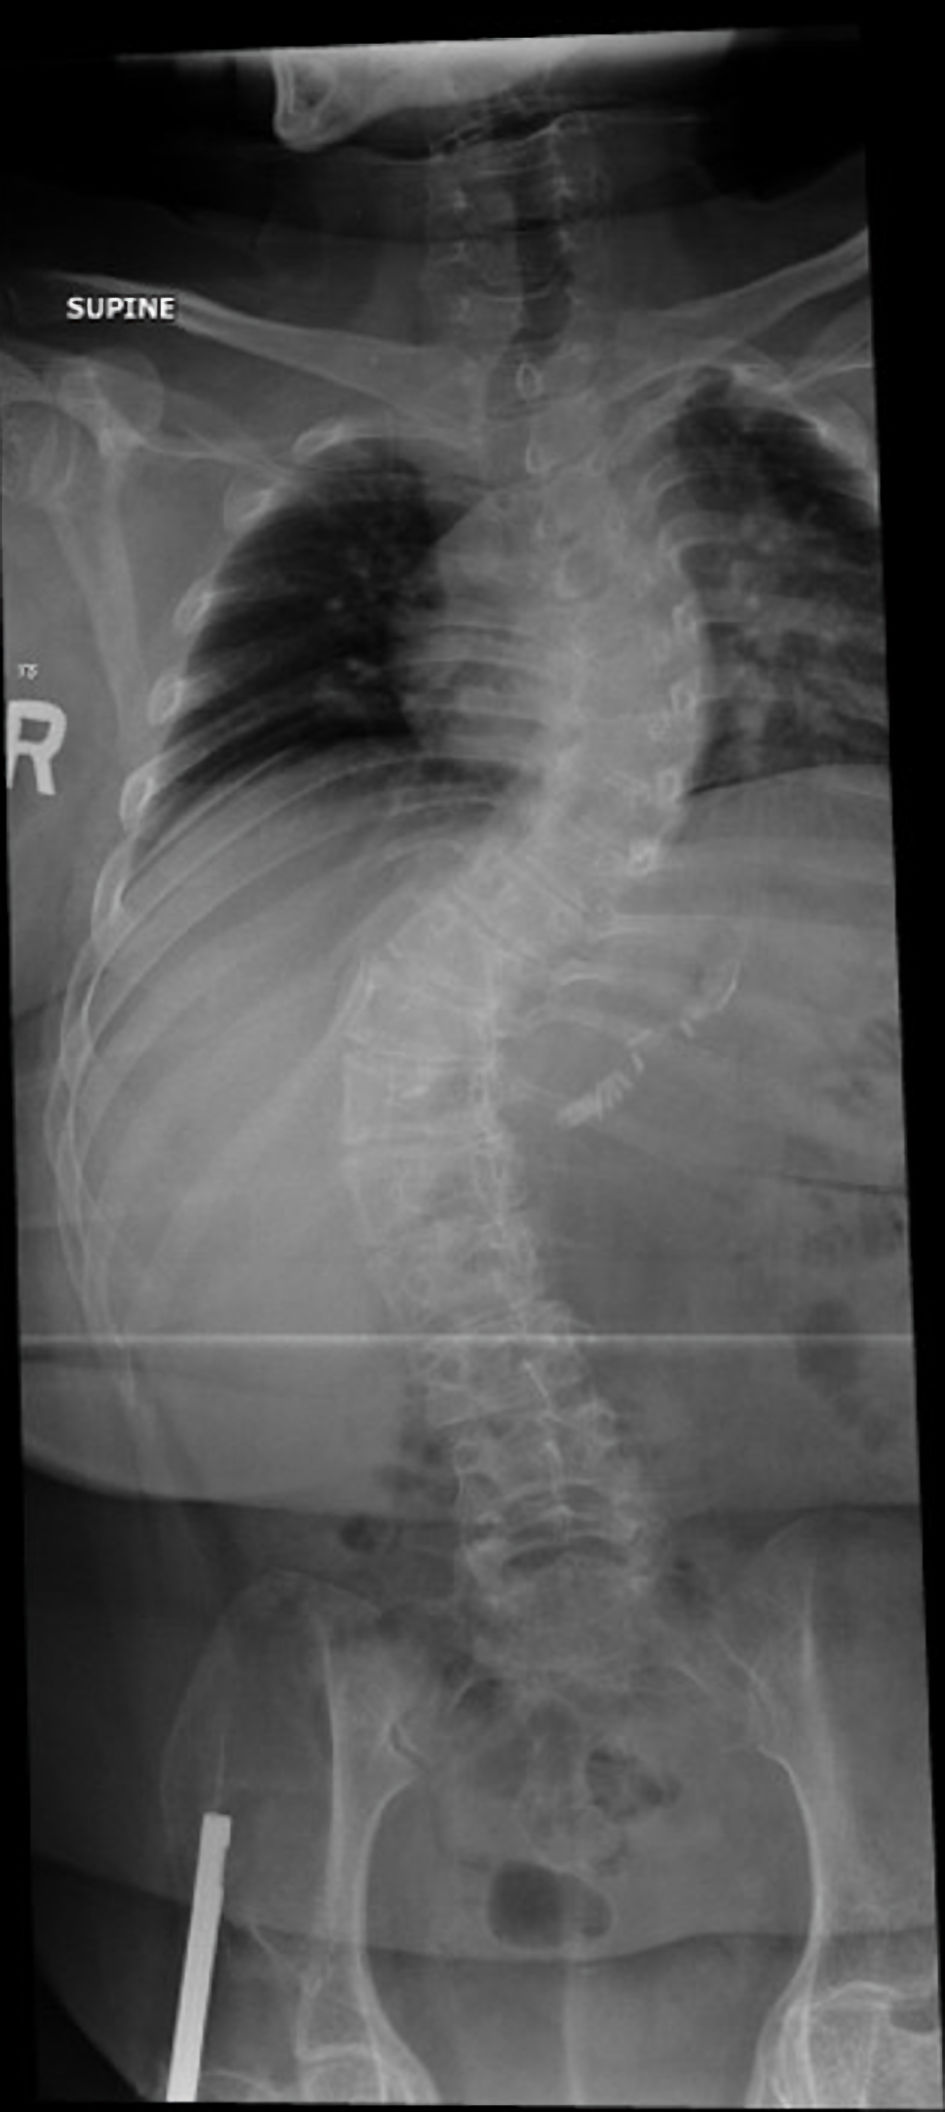
↓ Figure 1. CT scan of abdomen and pelvis showing generalized decreased bone density with multiple compression fractures of thoracolumbar spine. CT: computed tomography.
| Journal of Medical Cases, ISSN 1923-4155 print, 1923-4163 online, Open Access |
| Article copyright, the authors; Journal compilation copyright, J Med Cases and Elmer Press Inc |
| Journal website https://jmc.elmerpub.com |
Case Report
Volume 17, Number 8, August 2026, pages 415-423
Geroderma Osteodysplastica in Two Patients: Clinical, Genetic, and Management Insights
Figures
Tables
| Exam | Result | Reference range |
|---|---|---|
| Hb: hemoglobin; WBC: white blood cell; HbA1c: hemoglobin A1c; eGFR: estimated glomerular filtration rate; TV urine: 24-h urine total volume; U24 calcium: 24-h urinary calcium; U24 creatinine: 24-h urinary creatinine; ALT: alanine aminotransferase; AST: aspartate aminotransferase; LH: luteinizing hormone; FSH: follicle-stimulating hormone; TSH: thyroid-stimulating hormone; FT4: free thyroxine; PTH: parathyroid hormone; LDL: low-density lipoprotein cholesterol; HDL: high-density lipoprotein cholesterol; Alpha 1: alpha-1 globulin; Alpha 2: alpha-2 globulin; Beta 1: beta-1 globulin; Beta 2: beta-2 globulin; Gamma: gamma globulin; Pro El Interp: protein electrophoresis interpretation; M spike: monoclonal protein spike; VIT D 25 OH: 25-hydroxyvitamin D. | ||
| Hb | 164 | 130–170 g/L |
| WBC | 9.31 | 4.0–11.0 × 10⁹/L |
| Platelet | 252 | 150–400 × 109/L |
| HbA1c | 5.1% | ≤ 5.6% |
| Creatinine | 59 | 60–110 µmol/L |
| eGFR | 145 | > 90 mL/min/1.73 m2 |
| Adjusted calcium | 2.34 | 2.15–2.55 mmol/L |
| Phosphorus | 0.66 | 0.8–1.5 mmol/L |
| Magnesium | 0.84 | 0.7–1.0 mmol/L |
| Uric acid | 366 | 210–420 µmol/L |
| TV urine | 2,500 | 1,000–2,500/24 h |
| U24 calcium | 4.58 | 2.5–7.5 mmol/24 h |
| U24 creatinine | 13.5 | 9–18 mmol/24 h |
| Total bilirubin | 11.4 | 5–21 µmol/L |
| Alkaline phosphatase | 77 | 40–129 U/L |
| Total protein | 79 | 60–80 g/L |
| Albumin | 52 | 35–50 g/L |
| ALT | 17 | ≤ 41 U/L |
| AST | 20 | ≤ 40 U/L |
| Testosterone total | 21.09 | 8.0–30.0 nmol/L |
| LH | 0.98 | 1.7–8.6 IU/L |
| FSH | 2.10 | 1.5–12.4 IU/L |
| Prolactin | 144.93 | 86–324 mIU/L |
| TSH | 1.44 | 0.4–4.0 mIU/L |
| FT4 | 12.15 | 10–23 pmol/L |
| PTH | 3.110 | 1.6–6.9 pmol/L |
| LDL | 3.92 | < 2.6 mmol/L |
| HDL | 1.26 | ≥ 1.0 mmol/L |
| Total cholesterol | 5.40 | < 5.2 mmol/L |
| Triglycerides | 0.67 | < 1.7 mmol/L |
| Albumin E | 43.1 | 35–50 g/L |
| Alpha 2 | 6.3 | 4.8–10.5% |
| Beta 1 | 4.7 | 4.7–7.2% |
| Beta 2 | 4.8 | 3.2–6.5% |
| Gamma | 10.3 | 9–18% |
| Pro El Interp | Normal | Normal pattern |
| Alpha 1 | 2.8 | 1.4–3.0% |
| M spike g/L | 0 | Absent |
| M spike % | 0 | Absent |
| 25-OH Vit D | 80.7 | 50–125 nmol/L |
| Tissue transglutaminase IgA antibody | 0.89 | < 10 U/mL (negative) |
| Exam | Result | Reference range |
|---|---|---|
| WBC: white blood cell; Hb: hemoglobin; HbA1c: hemoglobin A1c; BUN: blood urea nitrogen; eGFR: estimated glomerular filtration rate; ALT: alanine aminotransferase; AST: aspartate aminotransferase; LH: luteinizing hormone; FSH: follicle-stimulating hormone; TSH: thyroid-stimulating hormone; PTH: parathyroid hormone; LDL: low-density lipoprotein cholesterol; HDL: high-density lipoprotein cholesterol; 25-OH Vit D: 25-hydroxyvitamin D. | ||
| WBC | 6.10 | 4.0–11.0 × 10⁹/L |
| Hb | 118 | 115–155 g/L |
| Platelet | 260 | 150–400 × 109/L |
| Ferritin | 9.4 | 15–150 µg/L |
| HbA1C | 5.5 | ≤ 5.6% normal |
| Creatinine | 43 | 45–90 µmol/L |
| BUN | 4.3 | 2.5–7.1 mmol/L |
| eGFR | 153 | > 90 mL/min/1.73 m2 |
| Sodium | 138 | 135–145 mmol/L |
| Potassium | 3.8 | 3.5–5.0 mmol/L |
| Adjusted calcium | 2.21 | 2.15–2.55 mmol/L |
| Phosphorus | 1.28 | 0.8–1.5 mmol/L |
| Magnesium | 0.86 | 0.7–1.0 mmol/L |
| ALT | 23 | ≤ 33 U/L |
| AST | 19 | ≤ 32 U/L |
| Total bilirubin | 6.3 | 5–21 µmol/L |
| Alkaline phosphatase | 70 | 35–104 U/L |
| Total protein | 63 | 60–80 g/L |
| FSH | 4.34 | 3.5–12.5 IU/L (follicular), 1.7–7.7 IU/L (luteal) |
| LH | 6.91 | 2.4–12.6 IU/L (follicular), 0.5–16.9 IU/L (luteal) |
| Testosterone total | 2.14 | 0.3–2.4 nmol/L |
| TSH | 1.56 | 0.4–4.0 mIU/L |
| Prolactin | 300.9 | 102–496 mIU/L |
| Total 25-OH Vit D | 64.0 | 50–125 nmol/L |
| PTH | 11.49 | 1.6–6.9 pmol/L |
| LDL | 3.49 | < 3.0 mmol/L |
| HDL | 1.19 | > 1.0 mmol/L |
| Total cholesterol | 5.05 | < 5.2 mmol/L |
| Triglycerides | 1.69 | < 1.7 mmol/L |
| Case 1 | Case 2 | |
|---|---|---|
| BMD: bone mineral density; PTH: parathyroid hormone. | ||
| Age | 34 years old | 35 years old |
| Gender | Male | Female |
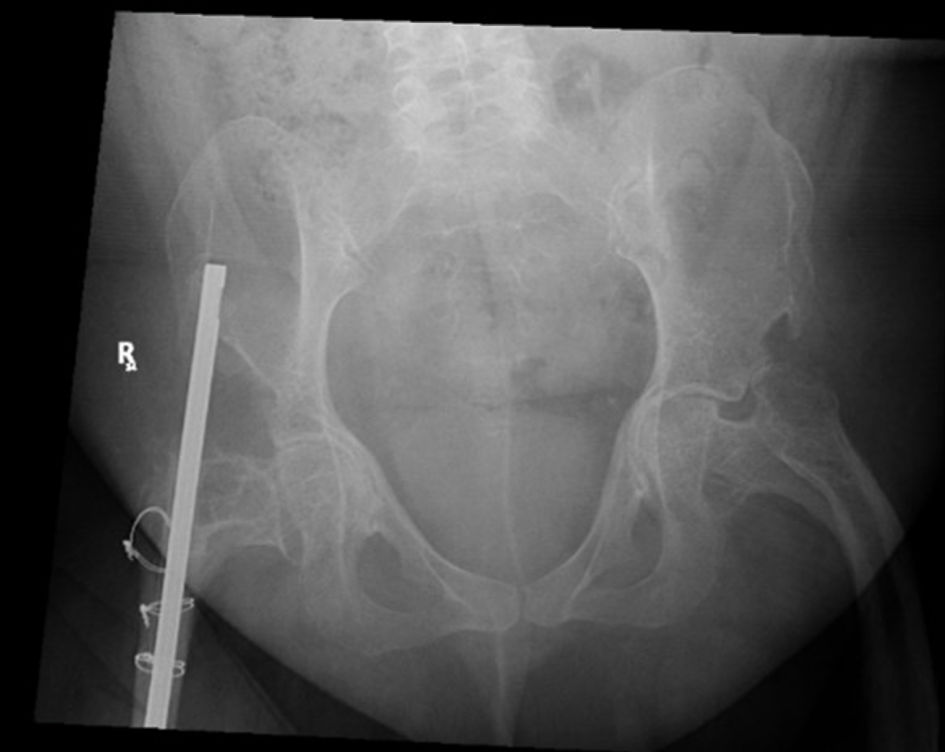
| Major clinical features | Osteoporosis, multiple fragility fractures, congenital hip dislocation, and low BMD | Prior steroid exposure, obesity, wheelchair dependence, low ferritin, and elevated PTH, scleroderma, longstanding skeletal fragility, scoliosis, and prior hip fixation and low BMD |
| Fracture history | Thoracolumbar compression fractures, left ankle fracture | Right hip fracture |
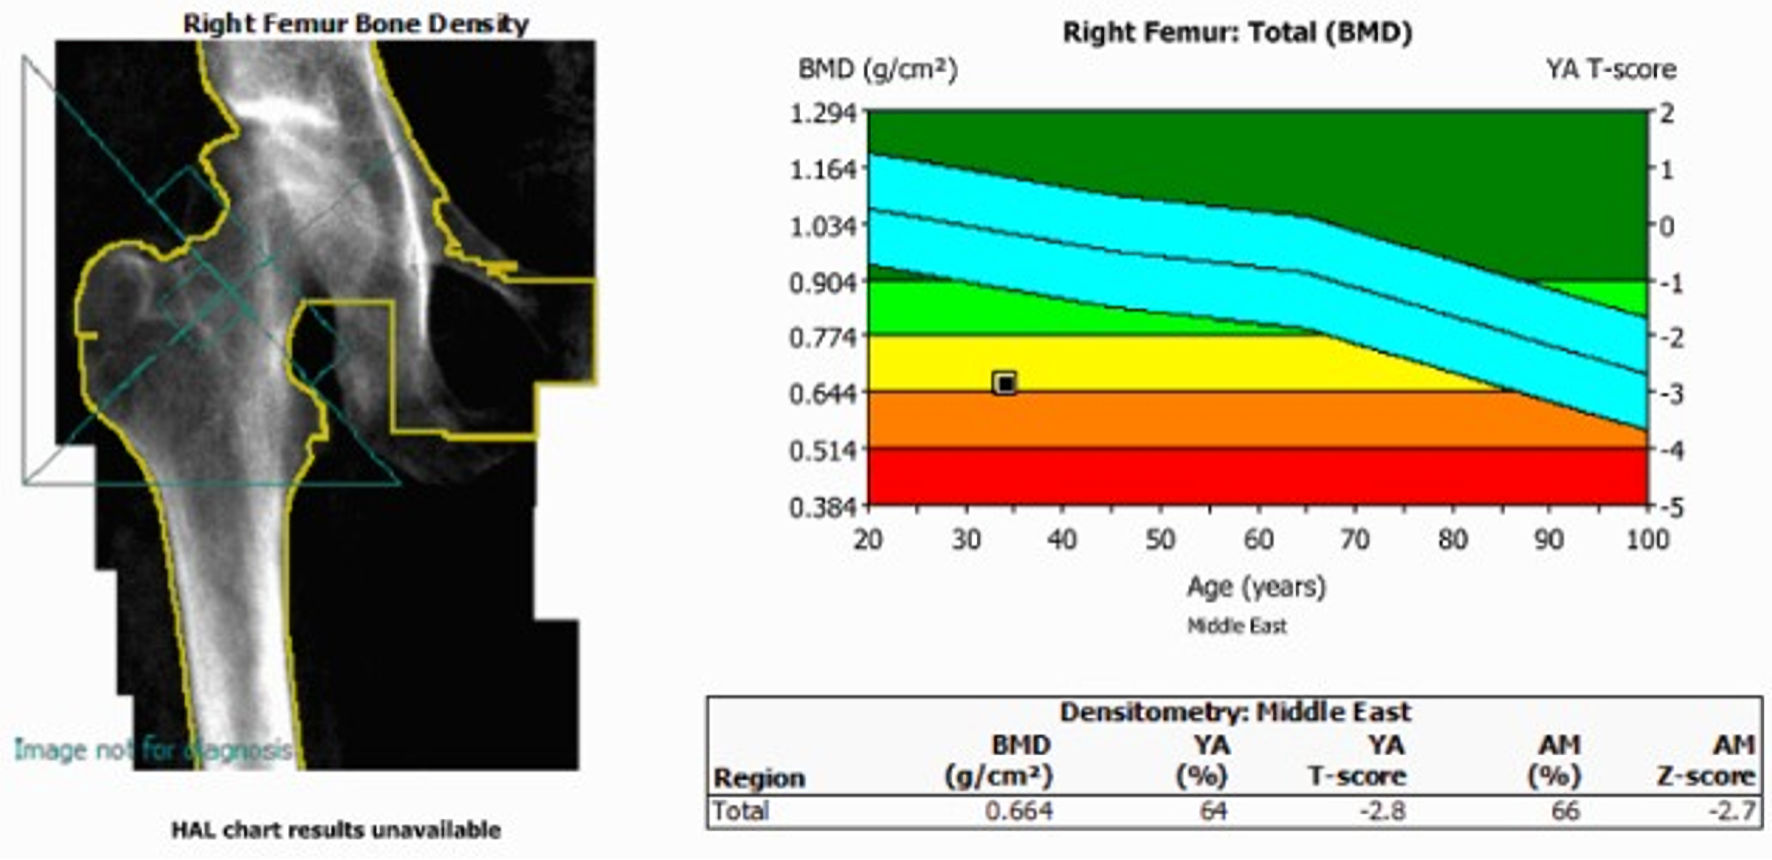
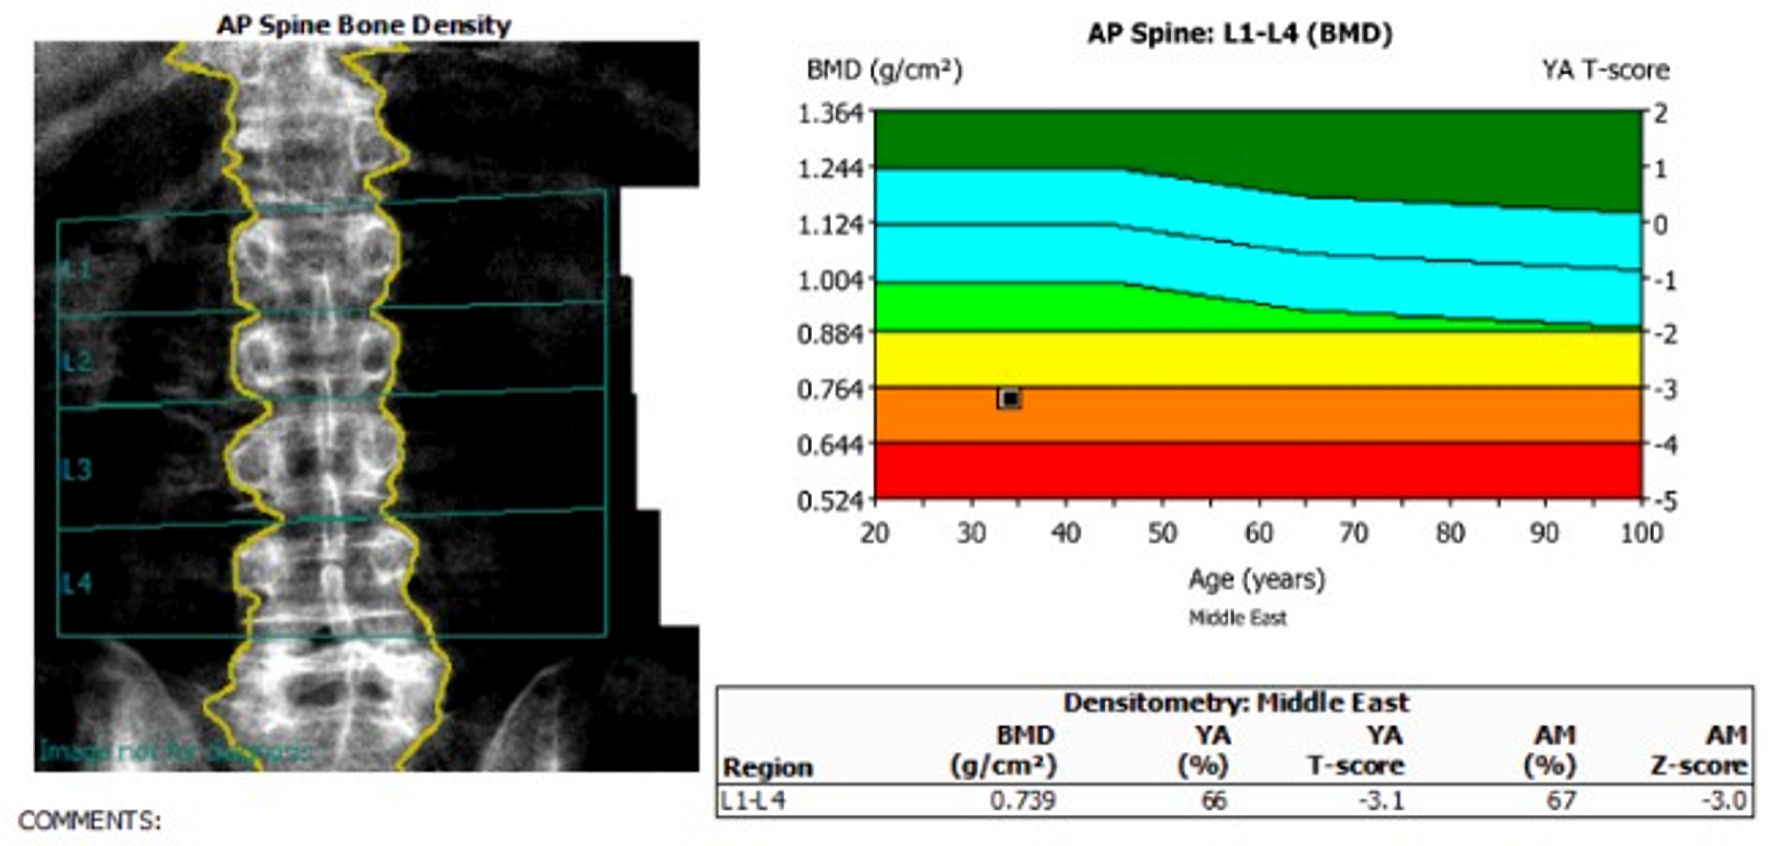
| BMD values | Right proximal femur Z-score of −2.7, and right femoral neck Z-score of −1.8; a lumbar spine Z-score of −3.0 | Lumbar spine Z-score of–1.9, right proximal femur Z-score –0.6, and right femoral neck Z-score –2.9 |
| Genetic variant | GORAB, NM_152281.2.306dup (p.(Pro103Thrfs*20)) | GORAB, NM_152281.2.306dup (p.(Pro103Thrfs*20)) |
| Treatment | Romosozumab for 1 year, cholecalciferol 50,000 IU/month, calcium carbonate 600 mg/day | Annual zoledronic acid infusion, along with calcium and vitamin D supplementation |
| Follow-up and outcomes | Romosozumab was administered for 8 doses initially and later completed with an additional 4 doses; BMD remained stable, followed by treatment with zoledronic acid | No new fracture or adverse event report during 3-year follow-up, and 5% BMD improved |