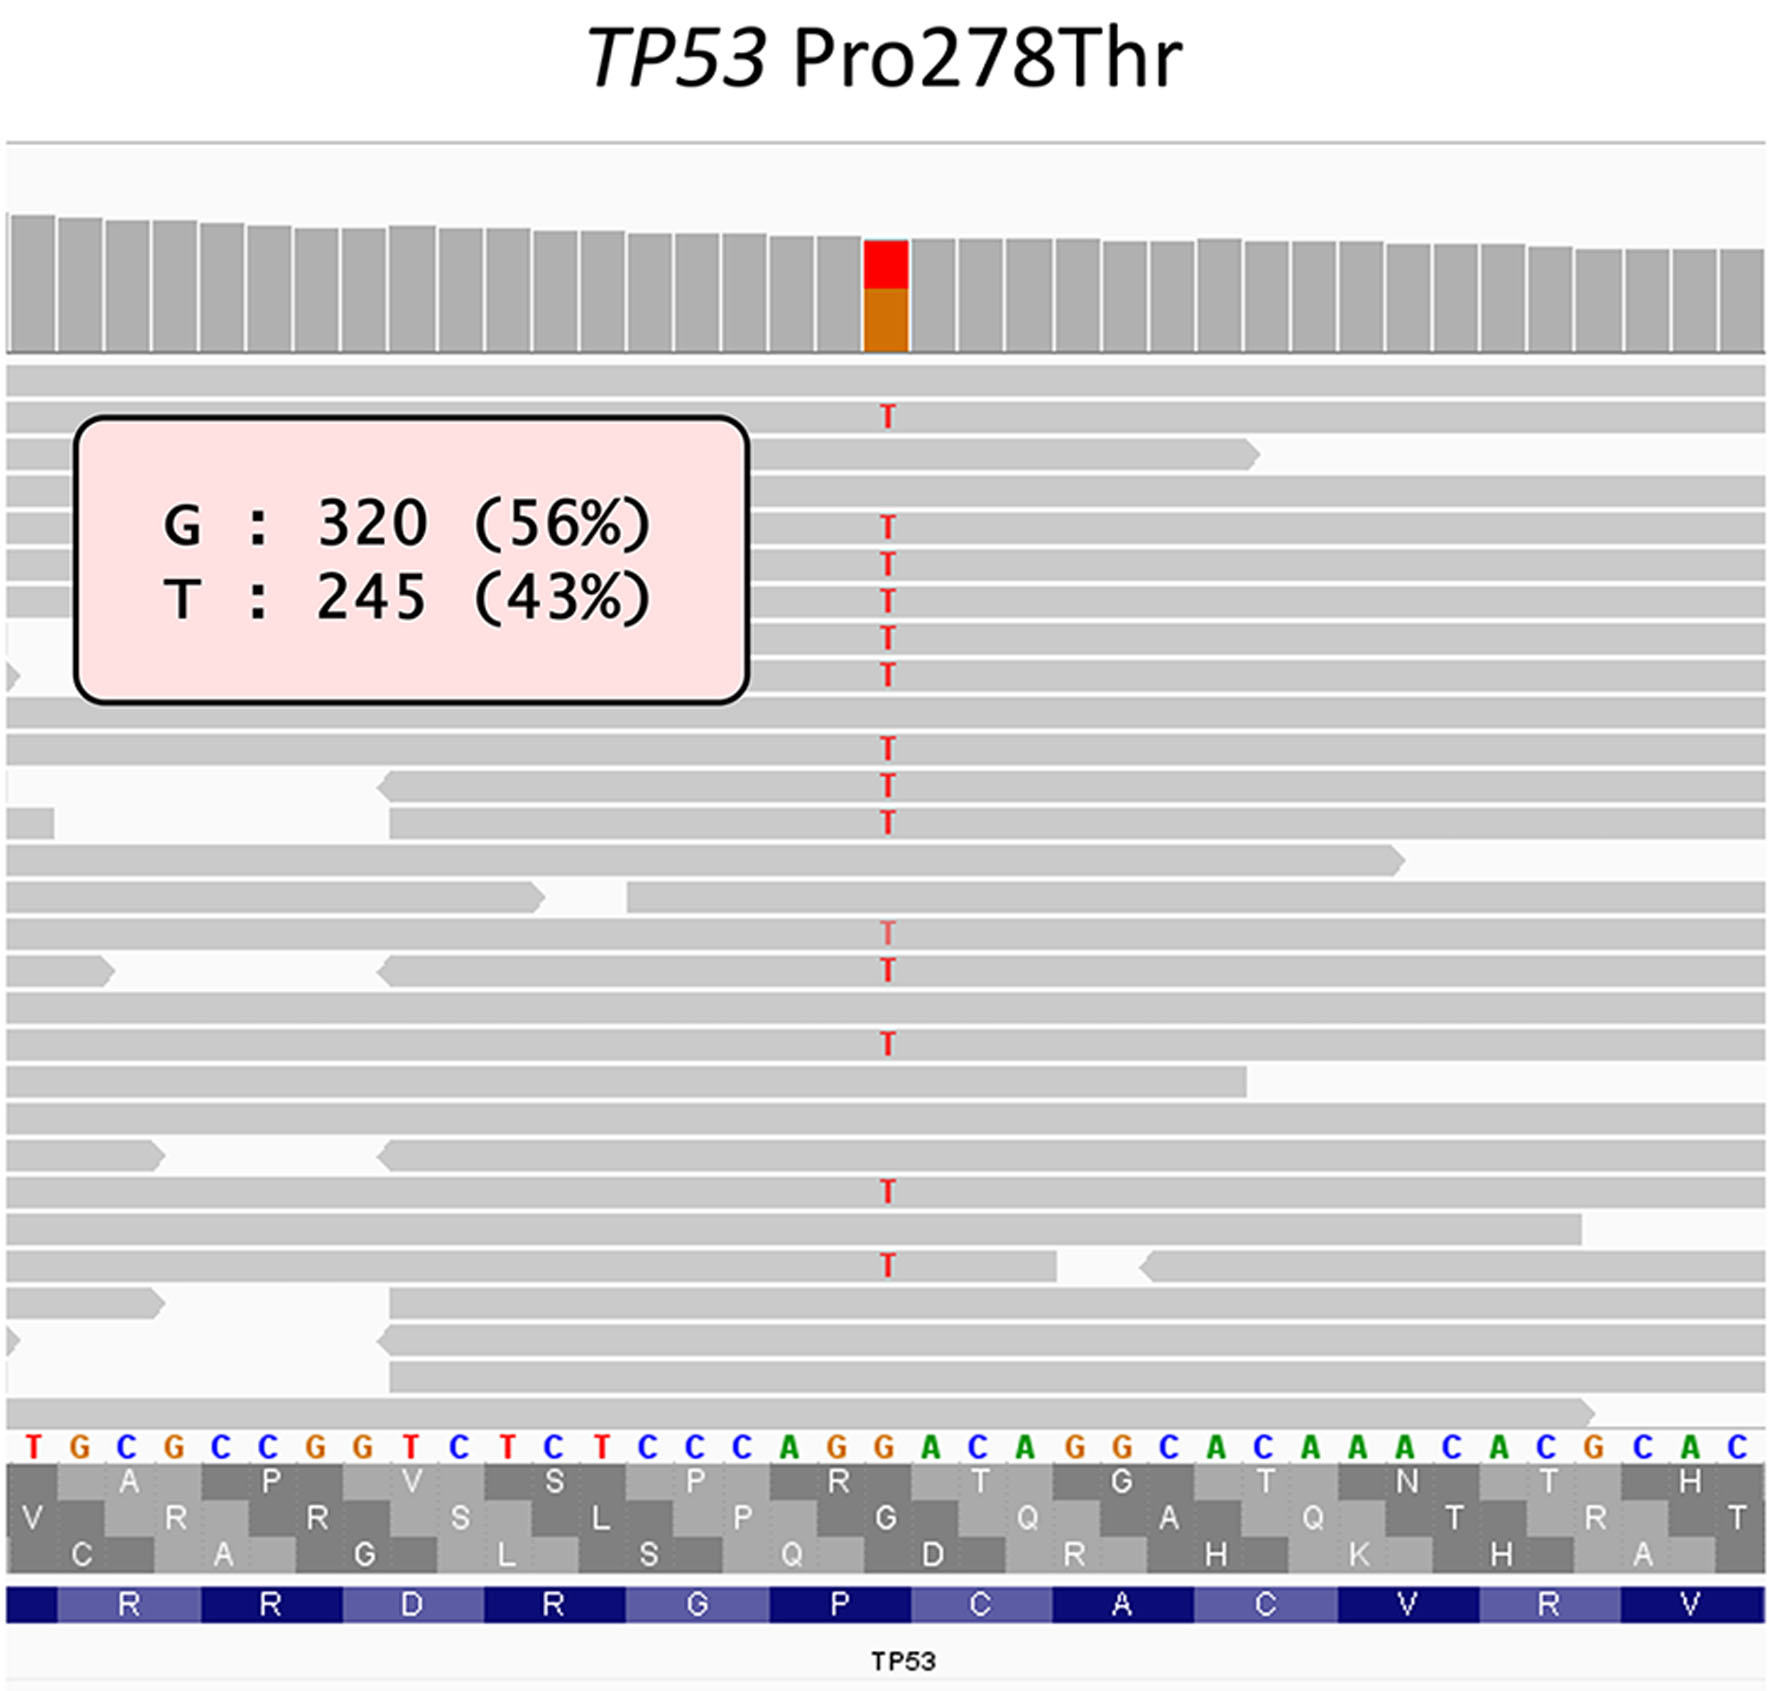
↓ Figure 1. Macroscopic images of the resected specimen and histopathological findings of invasive component. (a) A tumor measuring 35 × 30 mm in size was observed on the posterior wall of the upper gastric body (scale bar: 5 cm). (b) The lesion borders were indistinct (arrow heads) (scale bar: 1 cm). (c) The cut surface of the tumor (scale bar: 1 cm). (d) Loupe view, tubular adenocarcinoma invading the subserosal layer. (e) A representative image of invasive tubular adenocarcinoma (yellow frame in d).
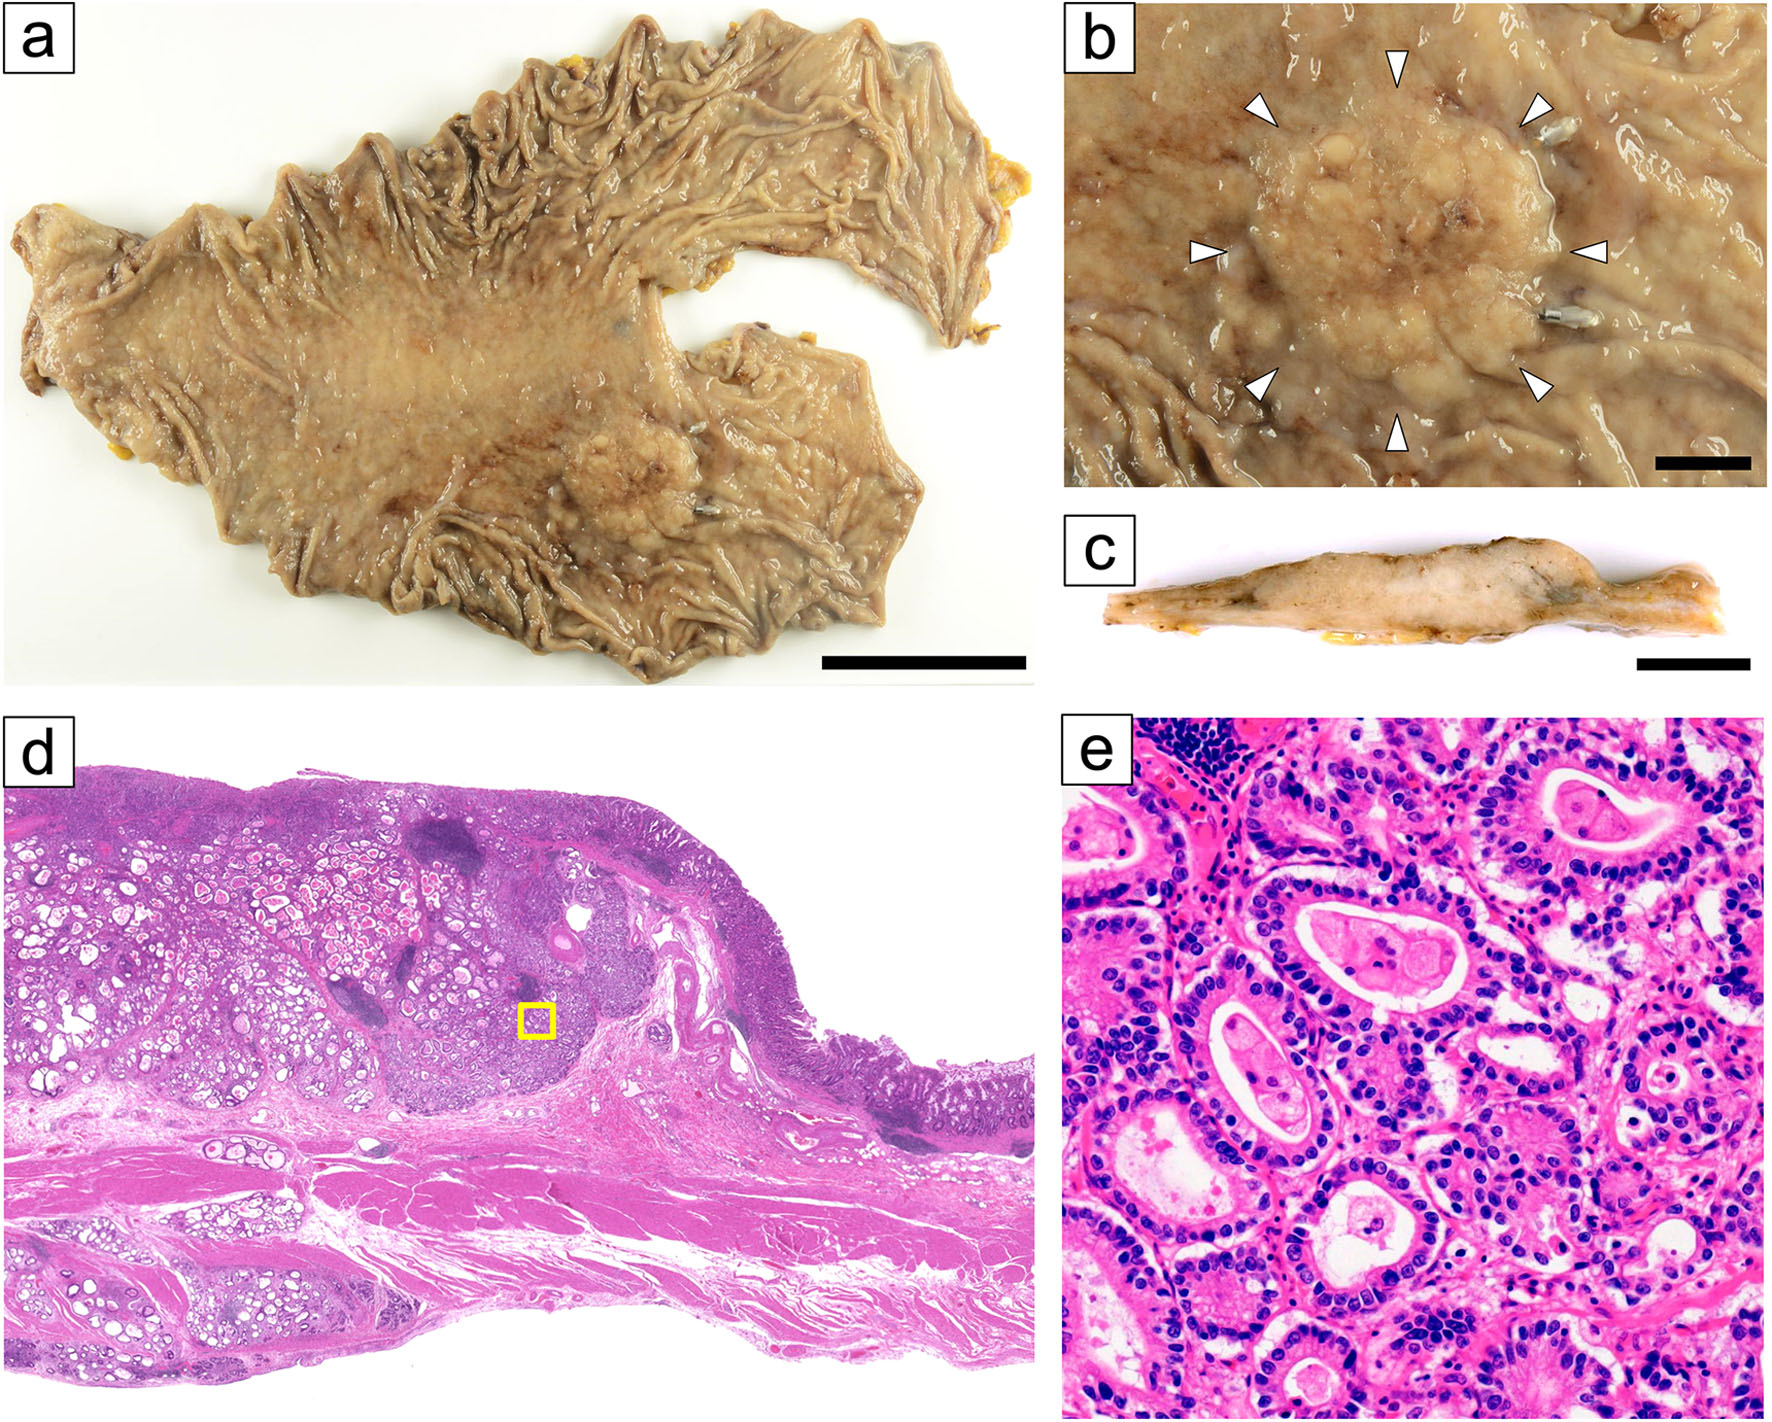
↓ Figure 2. Histopathological findings with a focus on oxyntic gland neoplasm component. (H&E stain: a, c, d) (a, b) Loupe view. (b) This tumor consisted of three histological components: the largest proportion (> 90%) was intestinal-type adenocarcinoma (green area); we noted an oxyntic gland neoplasm (OGN) component with mild nuclear atypia in the edge of the mucosal component (surrounded by a black dashed line); the OGN component also contained an area (red) with nuclear atypia higher than in the dashed line area. (c) The OGN component with mild nuclear atypia (yellow frame in a; inside the black dashed area in b). Here we noted branching glands (arrowheads) and a small focus suggestive of pseudoinvasion (arrow) (d) The OGN component predominantly showed chief cell morphology, with positivity for MUC6 (e) and pepsin A (f).
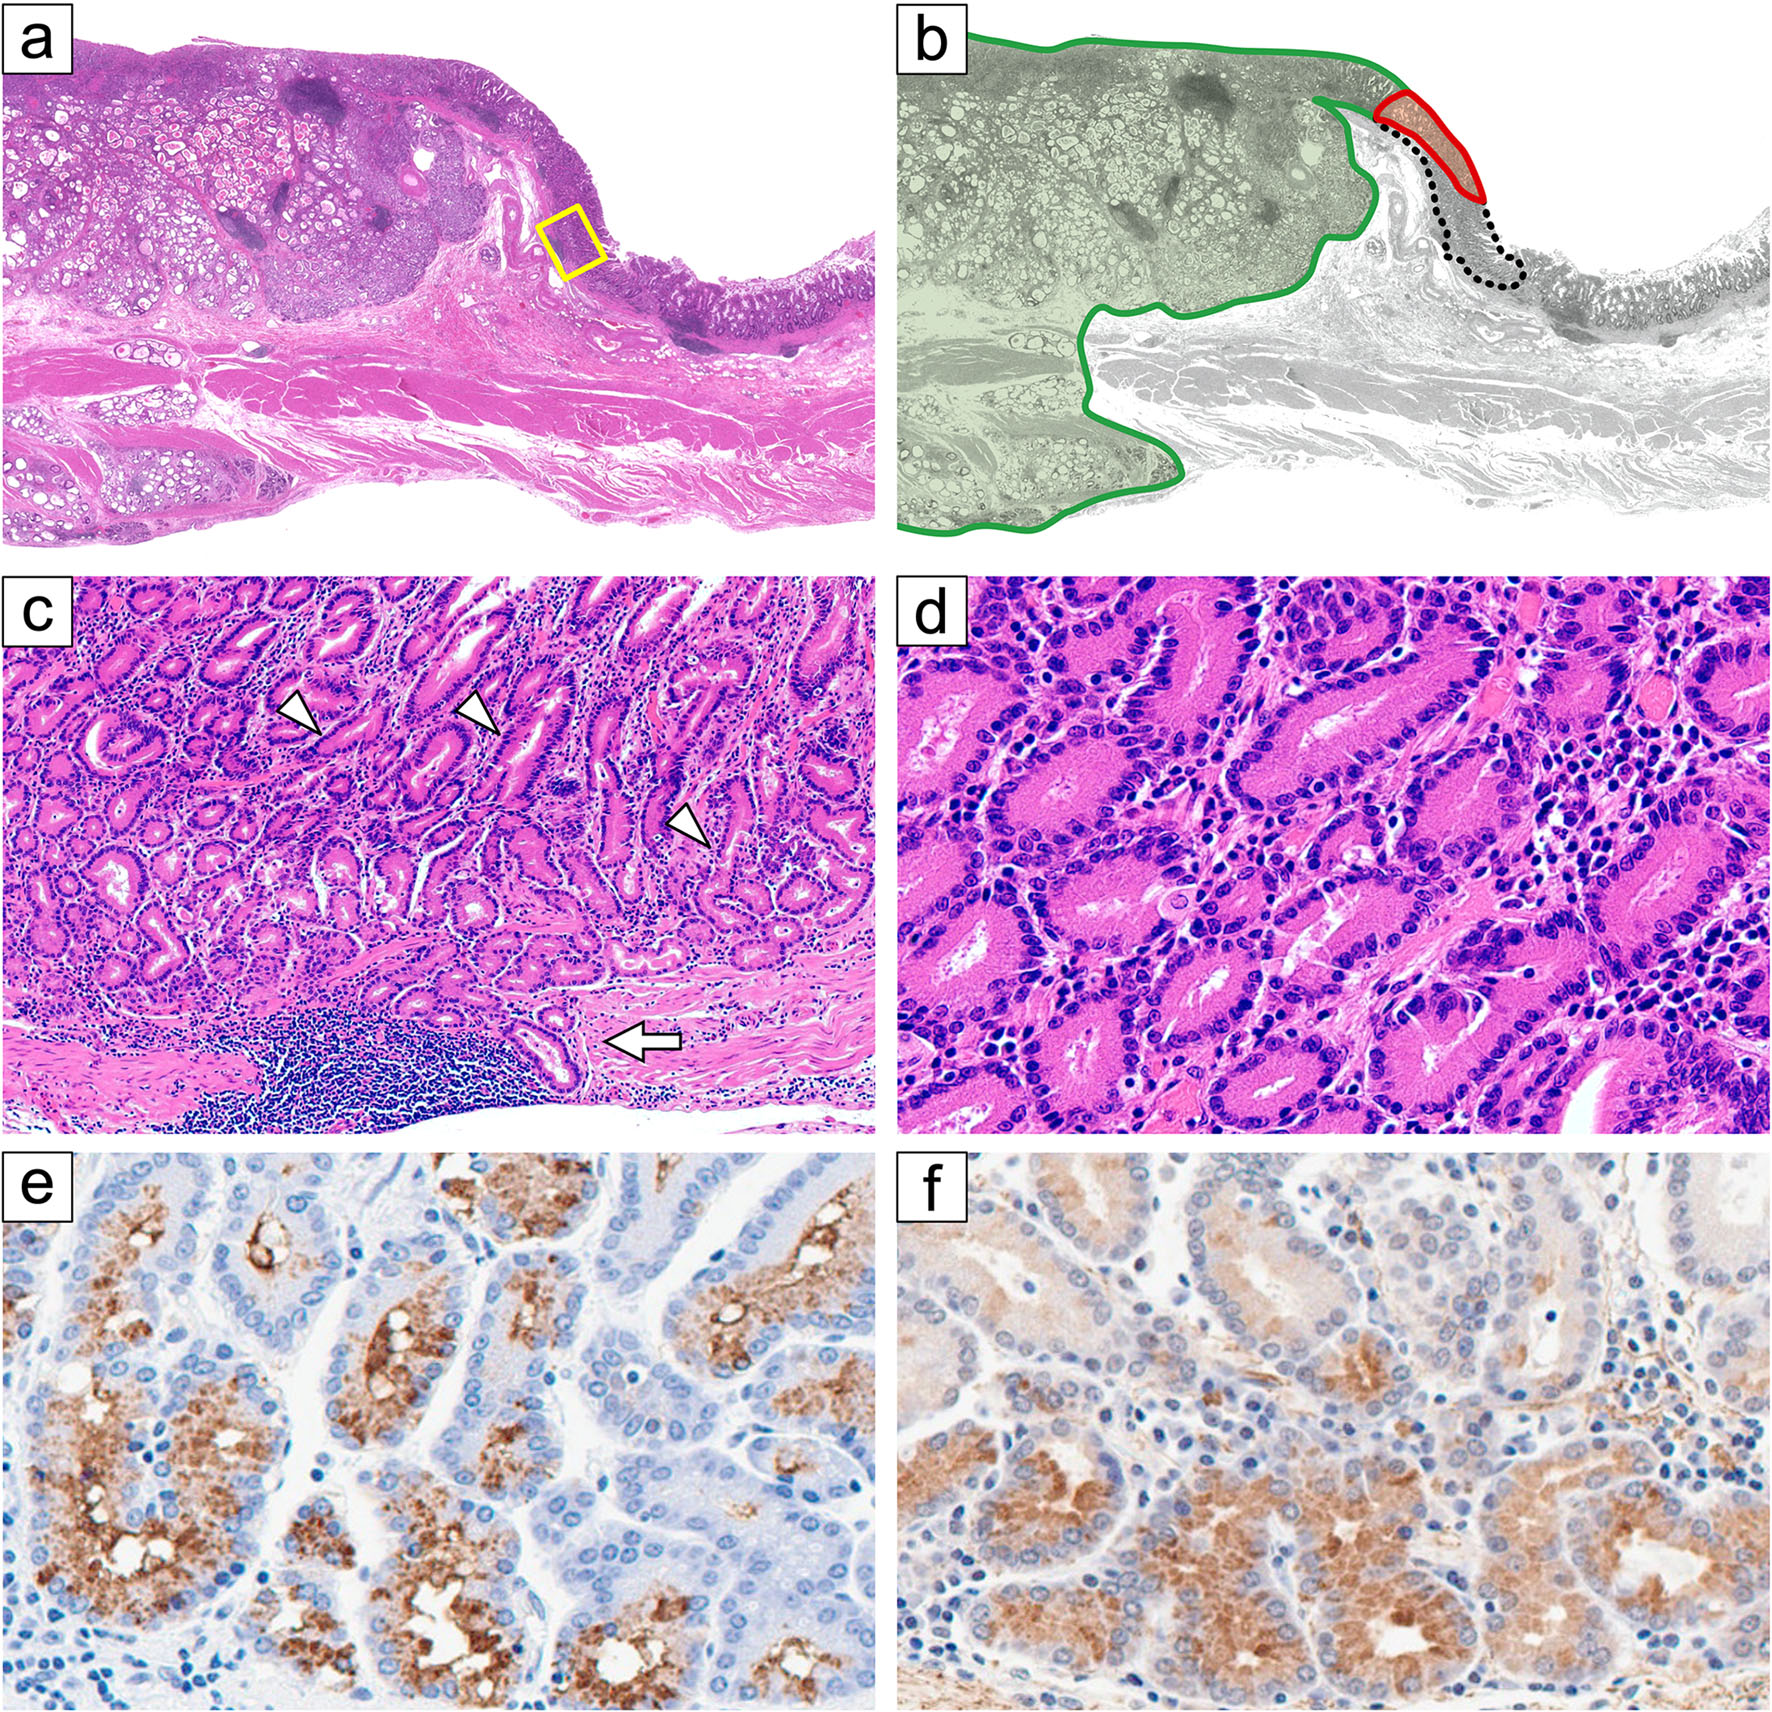
↓ Figure 3. A detailed assessment of the role of TP53 utilizing a p53/MUC5AC double stain. (a) Loupe view of double staining with MUC5AC (red) and p53 (brown). (b) High power view (red frame in a, double stain) of the massively invasive component (corresponding to Fig. 1e), showing diffuse p53 positivity. Low power panoramic view (c, d; black frame in a) and high power view (e, f) of the mucosal oxyntic gland neoplasm component. (d and f) Double stains with p53 (brown, nuclei) and MUC5AC (red, cytoplasmic). The surface of this area is covered by foveolar epithelium showing MUC5AC positivity (stained red). The area of e and f is indicated by black frames in c and d, respectively. A shift in the p53 staining pattern (brown in d and f) occurred within the foveolar component (stained red). This p53 immunohistochemical shift corresponds with the morphological shift (arrows). Note that the p53-positive area (left in f) shows a slightly higher grade of atypia (left in e) than in the other glands, with a 1.2–1.3-fold increase in cellularity and hyperchromasia. This border separates the red and black dashed line areas in Figure 2b.
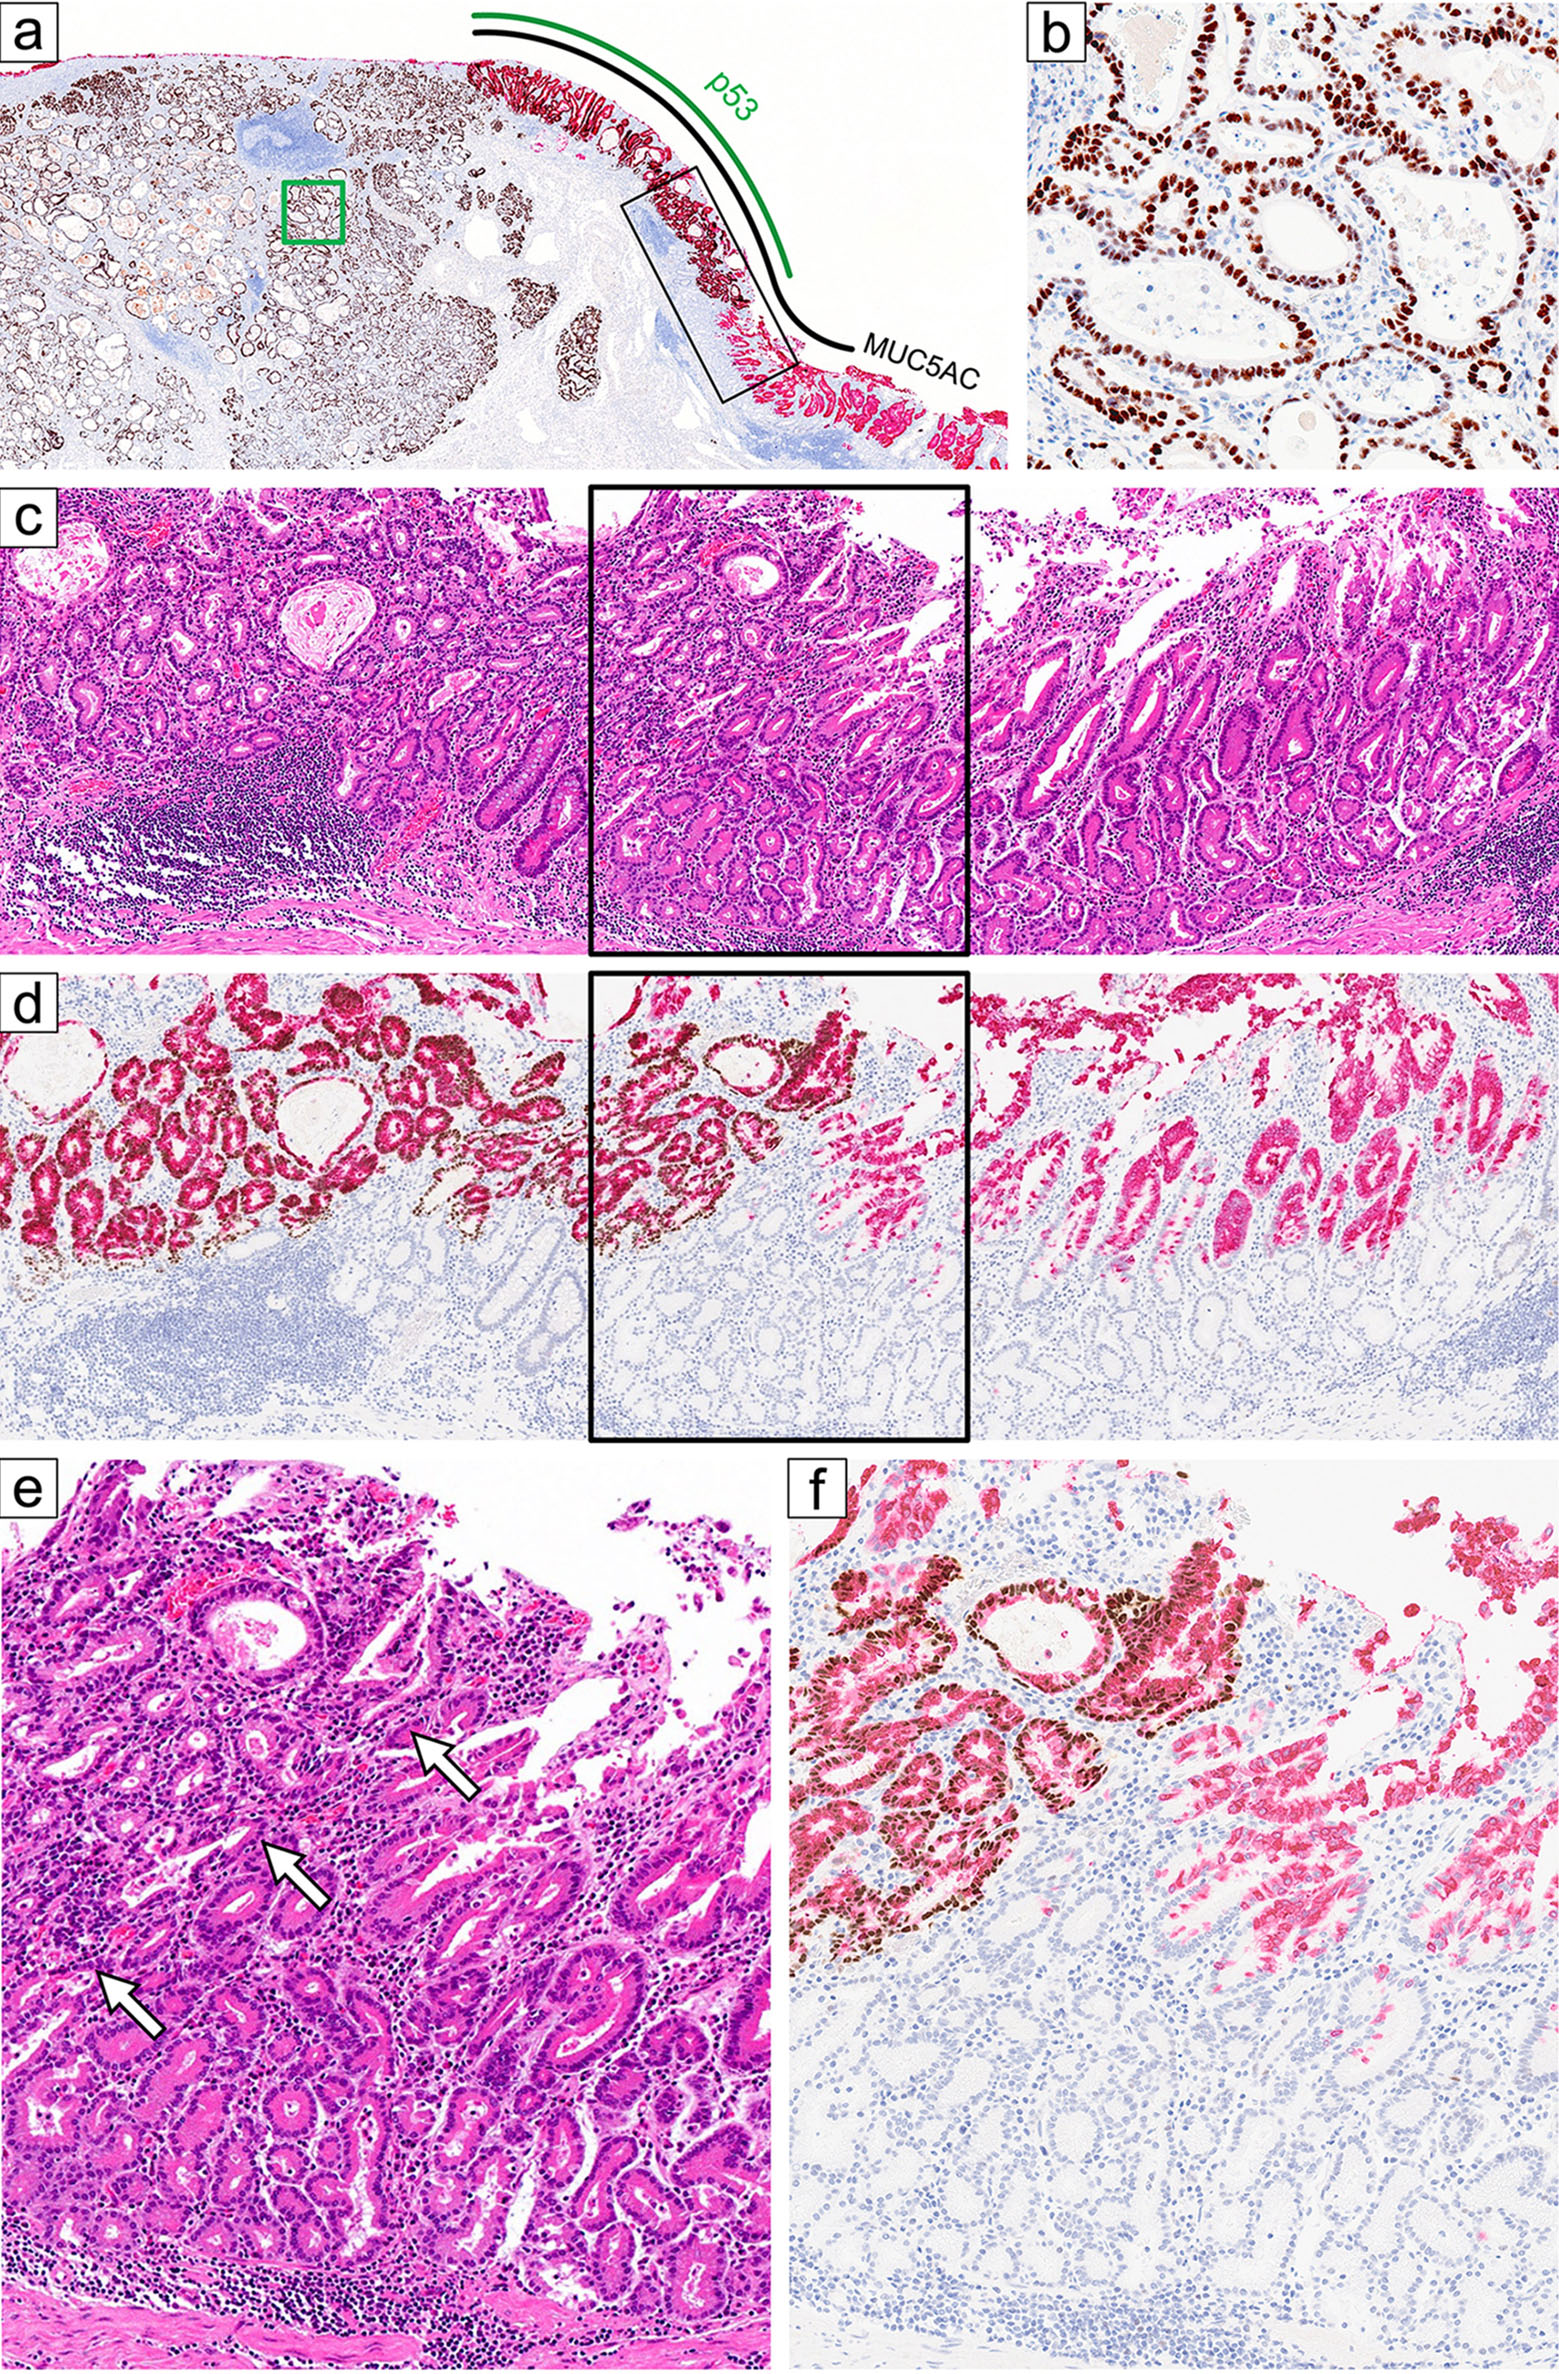
↓ Figure 4. Image of the reads of the TP53 mutation identified through sequencing 88 genes. Raw sequence data are displayed using the Integrative Genomics Viewer, showing TP53 c.832C>A (p.Pro278Thr) mutation. The entire tumor lesion of the representative slide was subjected to next-generation DNA sequencing.