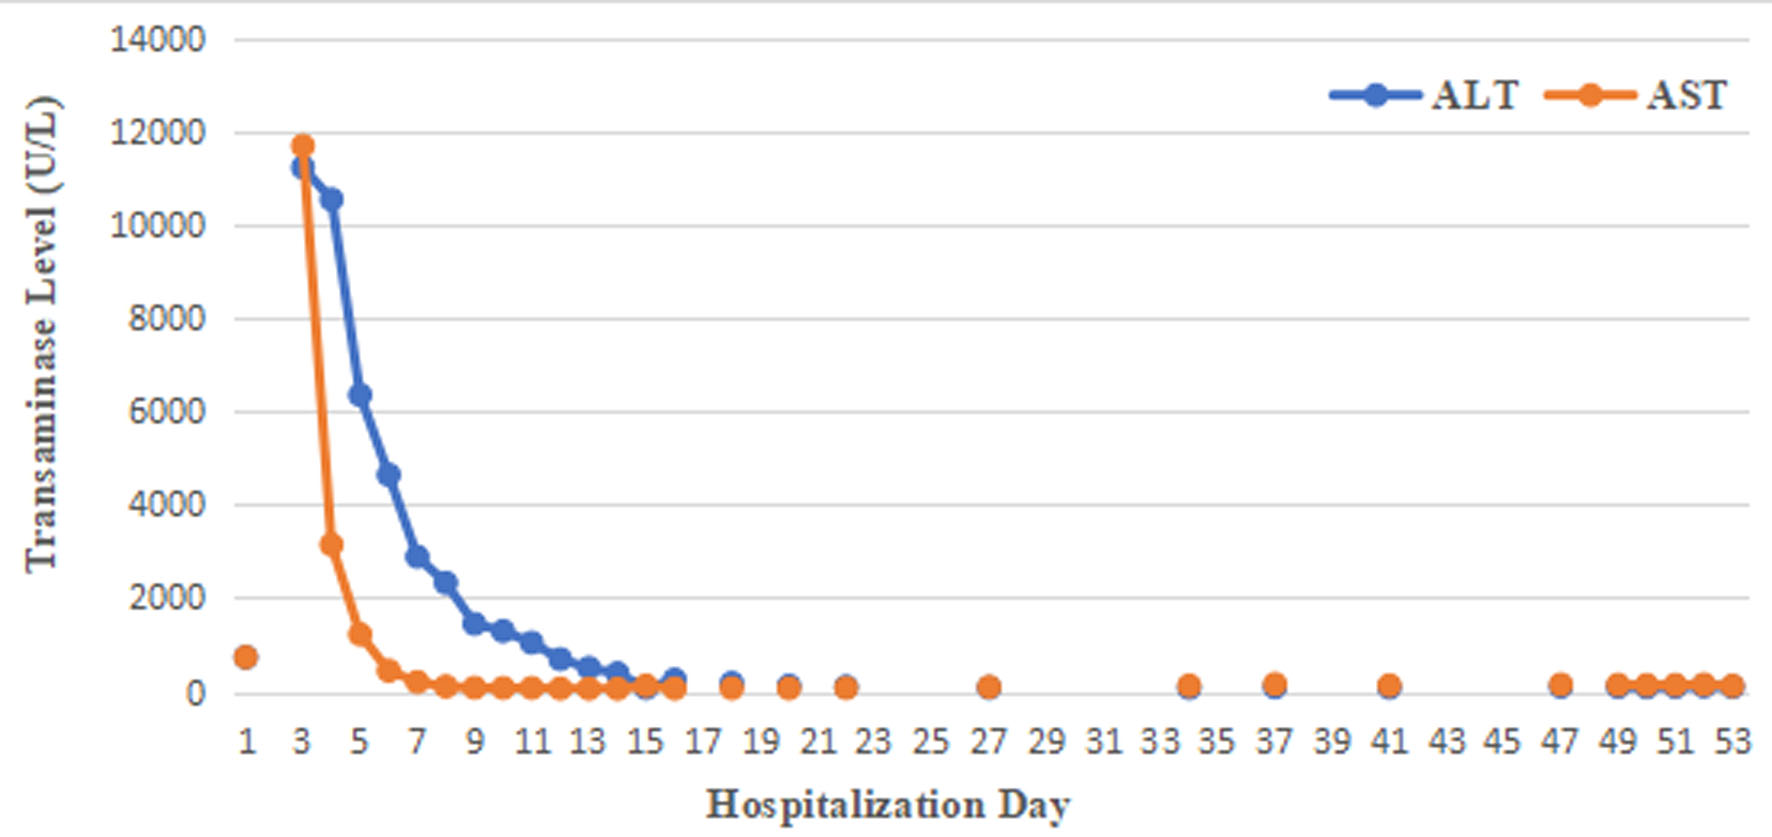
↓ Figure 1. Transaminase levels over time during hospitalization.
| Journal of Medical Cases, ISSN 1923-4155 print, 1923-4163 online, Open Access |
| Article copyright, the authors; Journal compilation copyright, J Med Cases and Elmer Press Inc |
| Journal website https://jmc.elmerpub.com |
Case Report
Volume 17, Number 7, July 2026, pages 309-320
Supportive Management of Severe Acetaminophen and Ibuprofen Overdose Twenty-Four Hours After Ingestion in Limited Resources Settings
Figures
Tables
| Day | ||||||||||||||
|---|---|---|---|---|---|---|---|---|---|---|---|---|---|---|
| 1 | 3 | 4 | 5 | 6 | 7 | 8 | 9 | 10 | 11 | 12 | 13 | 14 | 16 | |
| ALT: alanine aminotransferase; AST: aspartate aminotransferase. | ||||||||||||||
| ALT | 726 | 11,224 | 10,540 | 6,349 | 4,637 | 2,881 | 2,319 | 1,442 | 1,288 | 1,039 | 686 | 498 | 383 | 247 |
| AST | 728 | 11,688 | 3,139 | 1,217 | 438 | 197 | 101 | 73 | 69 | 69 | 57 | 54 | 52 | 56 |
| 18 | 20 | 22 | 24 | 27 | 34 | 37 | 41 | 47 | 49 | 50 | 51 | 52 | 53 | |
| ALT | 174 | 115 | 95 | 88 | 70 | 66 | 84 | 72 | 95 | 90 | 82 | 91 | 104 | 88 |
| AST | 60 | 59 | 67 | 79 | 90 | 120 | 153 | 125 | 144 | 138 | 132 | 135 | 145 | 115 |
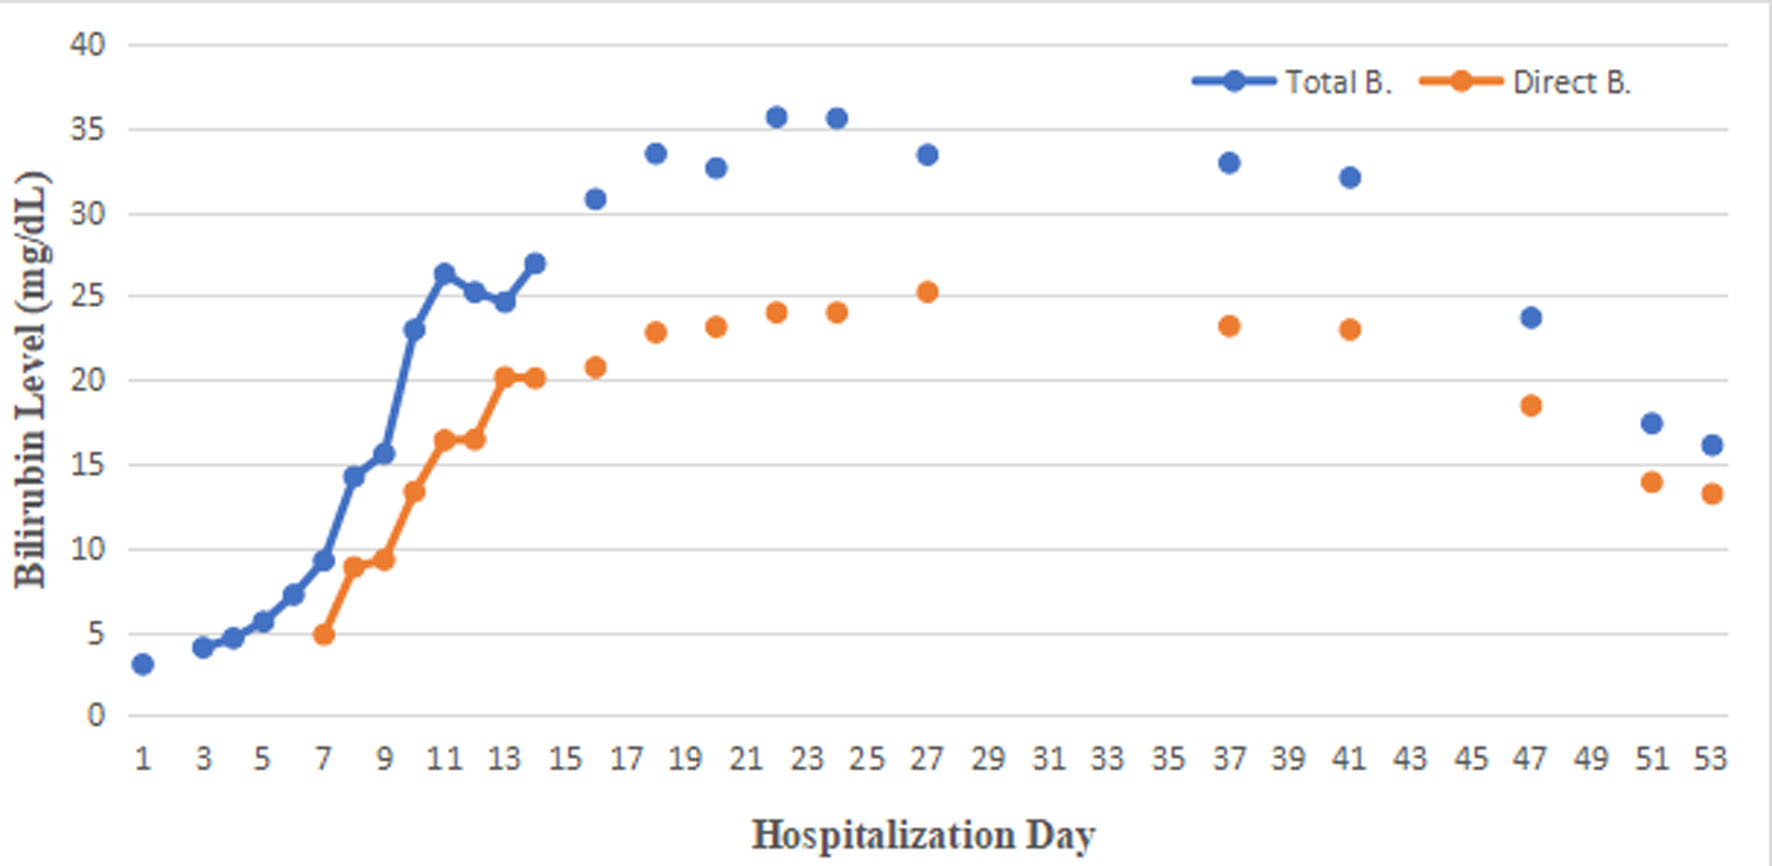
| Day | ||||||||||||
|---|---|---|---|---|---|---|---|---|---|---|---|---|
| 1 | 3 | 4 | 5 | 6 | 7 | 8 | 9 | 10 | 11 | 12 | 13 | |
| Total | 3.04 | 4.04 | 4.60 | 5.58 | 7.19 | 9.22 | 14.22 | 15.59 | 22.98 | 26.31 | 25.22 | 24.63 |
| Direct | 4.81 | 8.84 | 9.27 | 13.33 | 16.40 | 16.44 | 20.15 | |||||
| 14 | 16 | 18 | 20 | 22 | 24 | 27 | 37 | 41 | 47 | 51 | 53 | |
| Total | 26.93 | 30.76 | 33.47 | 32.61 | 35.65 | 35.58 | 33.40 | 32.92 | 32.05 | 23.7 | 17.4 | 16.1 |
| Direct | 20.09 | 20.74 | 22.82 | 23.15 | 24.01 | 24.43 | 25.23 | 23.20 | 22.99 | 18.46 | 13.90 | 13.20 |
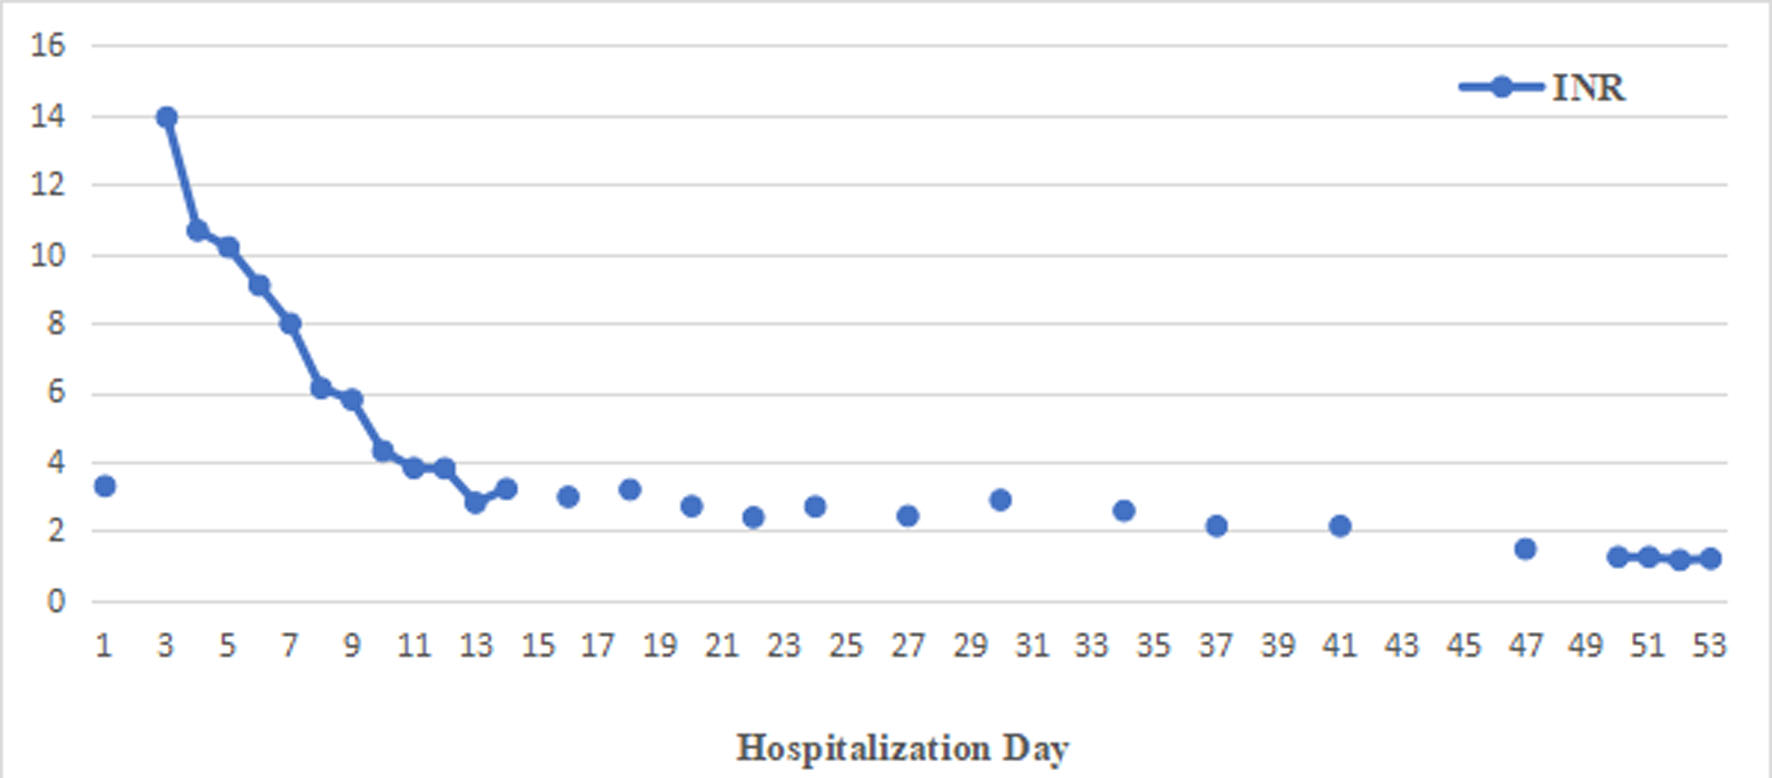
| Day | ||||||||||||||
|---|---|---|---|---|---|---|---|---|---|---|---|---|---|---|
| 1 | 3 | 4 | 5 | 6 | 7 | 8 | 9 | 10 | 11 | 12 | 13 | 14 | 16 | |
| INR: international normalized ratio. | ||||||||||||||
| INR | 3.29 | 13.91 | 10.65 | 10.17 | 9.07 | 7.97 | 6.11 | 5.78 | 4.30 | 3.81 | 3.80 | 2.81 | 3.21 | 2.98 |
| 18 | 20 | 22 | 24 | 27 | 30 | 34 | 37 | 41 | 47 | 50 | 51 | 52 | 53 | |
| INR | 3.19 | 2.71 | 2.39 | 2.70 | 2.43 | 2.89 | 2.58 | 2.14 | 2.14 | 1.48 | 1.25 | 1.25 | 1.16 | 1.20 |
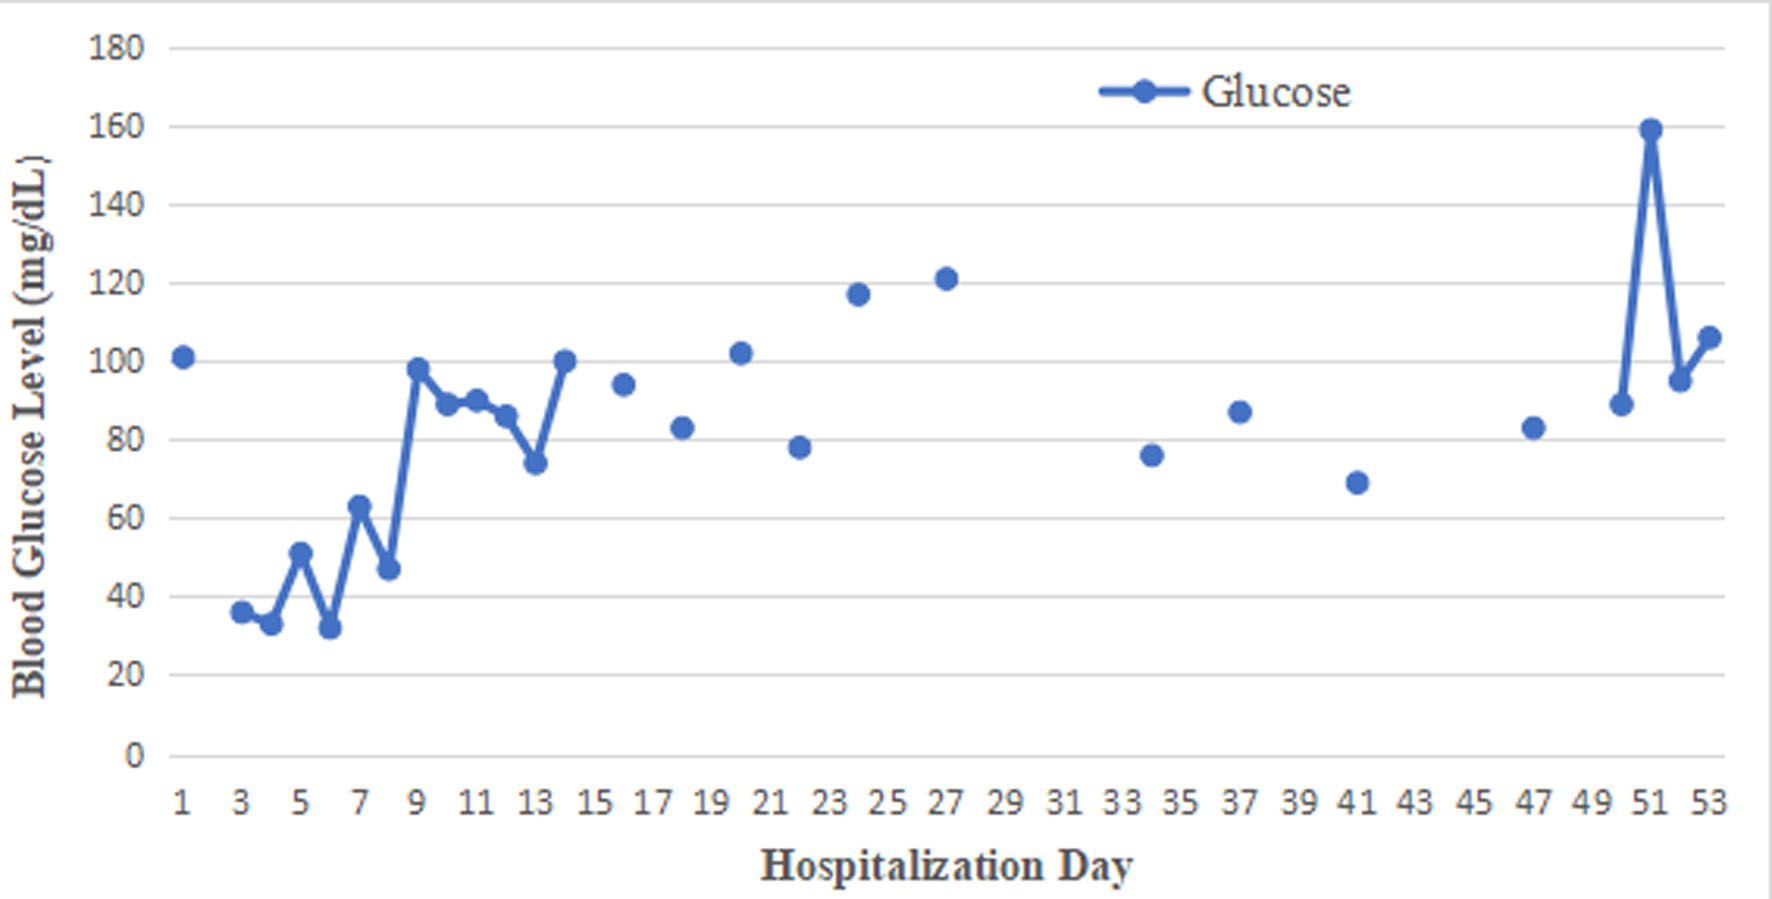
| Day | ||||||||||||||
|---|---|---|---|---|---|---|---|---|---|---|---|---|---|---|
| 1 | 3 | 4 | 5 | 6 | 7 | 8 | 9 | 10 | 11 | 12 | 13 | 14 | 16 | |
| Glucose | 101 | 36 | 33 | 51 | 32 | 63 | 47 | 98 | 89 | 90 | 86 | 74 | 100 | 94 |
| 18 | 20 | 22 | 24 | 27 | 34 | 37 | 41 | 47 | 50 | 51 | 52 | 53 | ||
| Glucose | 83 | 102 | 78 | 117 | 121 | 76 | 87 | 69 | 83 | 89 | 159 | 95 | 106 | |
| Day | ||||||||||||||
|---|---|---|---|---|---|---|---|---|---|---|---|---|---|---|
| 1 | 3 | 4 | 5 | 6 | 7 | 8 | 9 | 10 | 11 | 12 | 13 | 14 | 16 | |
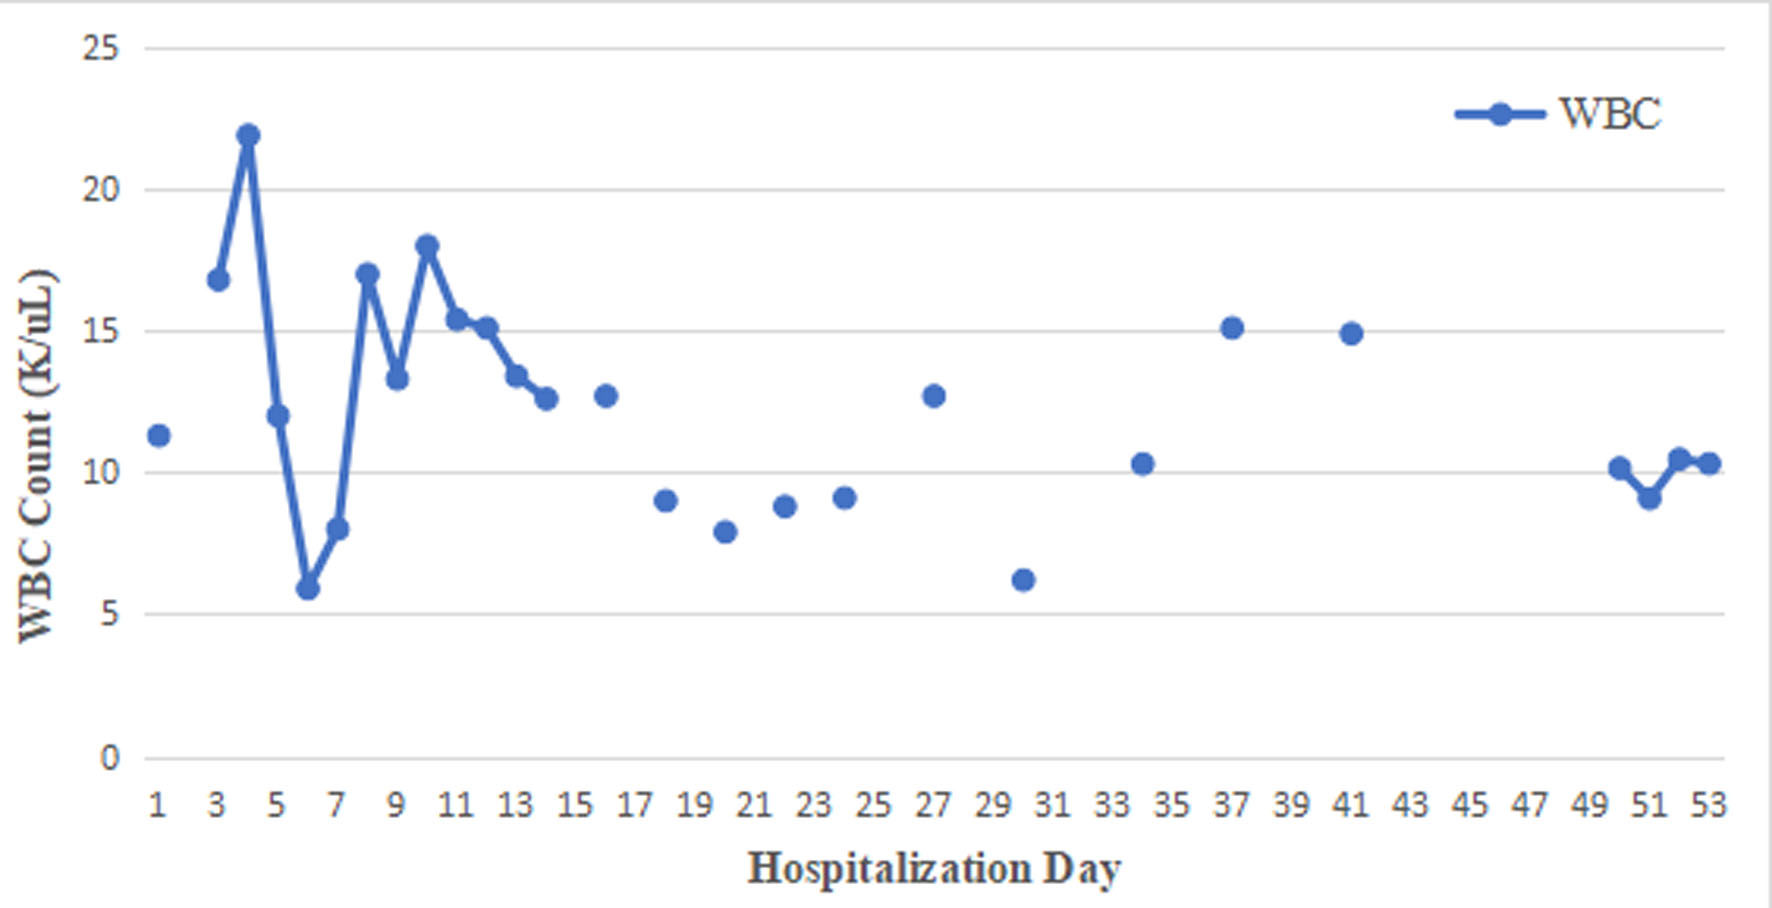
| WBC: white blood cell. | ||||||||||||||
| WBC | 11.3 | 16.8 | 21.9 | 12.0 | 5.9 | 8.0 | 17.0 | 13.3 | 18.0 | 15.4 | 15.1 | 13.4 | 12.6 | 12.7 |
| 18 | 20 | 22 | 24 | 27 | 30 | 34 | 37 | 41 | 50 | 51 | 52 | 53 | ||
| WBC | 9.0 | 7.9 | 8.8 | 9.1 | 12.7 | 6.2 | 10.3 | 15.1 | 14.9 | 10.15 | 9.08 | 10.47 | 10.31 | |
| Day | ||||||||||||||
|---|---|---|---|---|---|---|---|---|---|---|---|---|---|---|
| 1 | 3 | 4 | 5 | 6 | 7 | 8 | 9 | 10 | 11 | 12 | 13 | 14 | 16 | |
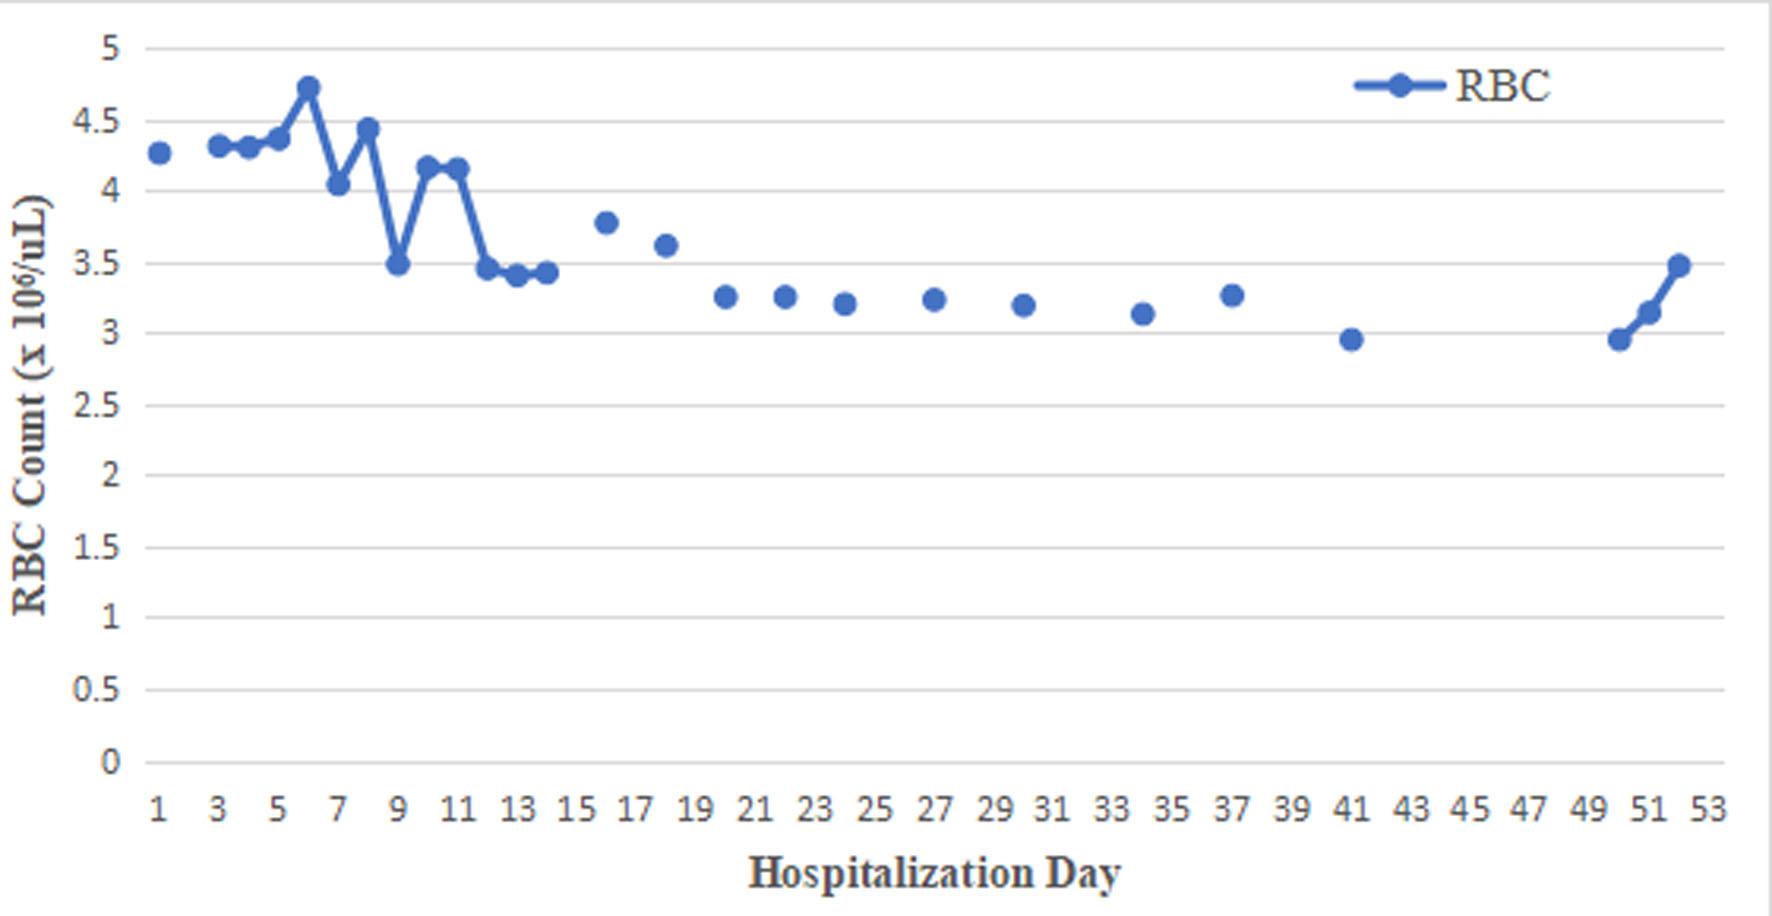
| RBC: red blood cell. | ||||||||||||||
| RBC | 4.26 | 4.31 | 4.30 | 4.36 | 4.72 | 4.07 | 4.43 | 3.48 | 4.16 | 4.15 | 3.45 | 3.40 | 3.42 | 3.77 |
| 18 | 20 | 22 | 24 | 27 | 30 | 34 | 37 | 41 | 50 | 51 | 52 | 53 | ||
| RBC | 3.61 | 3.25 | 3.25 | 3.20 | 3.23 | 3.19 | 3.13 | 3.26 | 2.95 | 2.95 | 3.14 | 3.47 | 3.33 | |
| Day | ||||||||||||||
|---|---|---|---|---|---|---|---|---|---|---|---|---|---|---|
| 1 | 3 | 4 | 5 | 6 | 7 | 8 | 9 | 10 | 11 | 12 | 13 | 14 | 16 | |
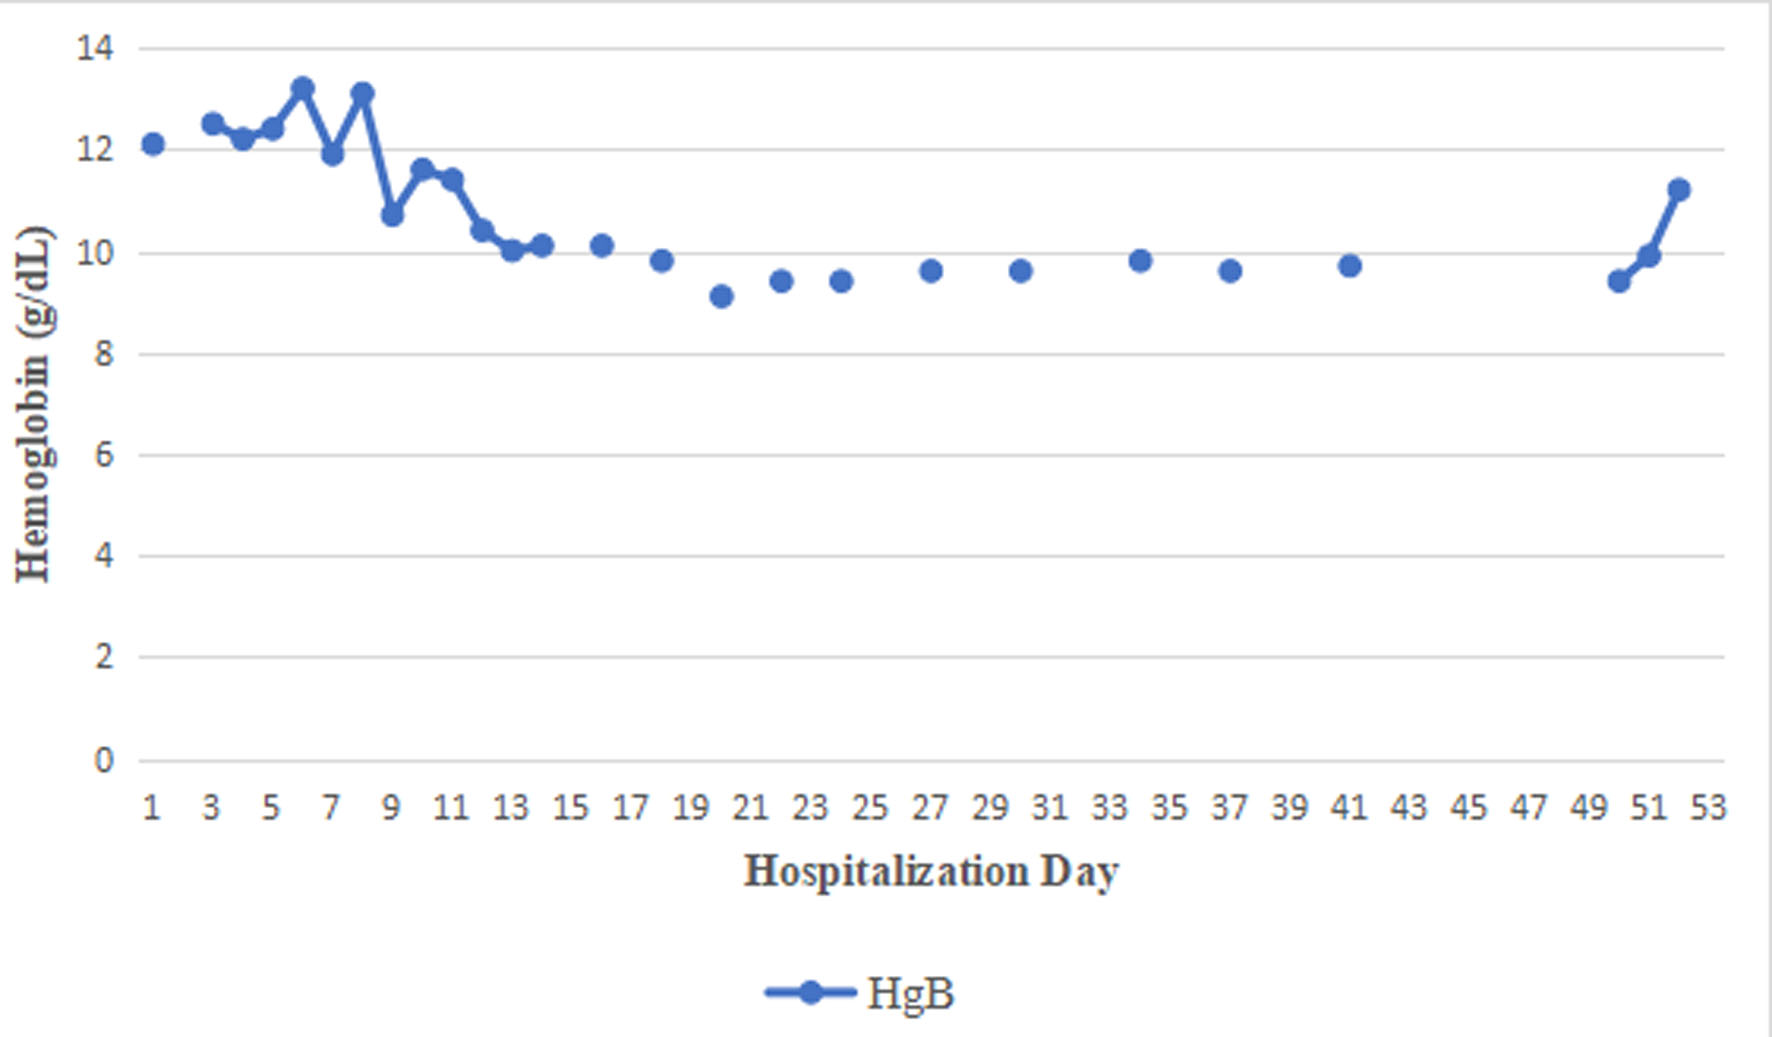
| HgB: hemoglobin. | ||||||||||||||
| HgB | 12.1 | 12.5 | 12.2 | 12.4 | 13.2 | 11.9 | 13.1 | 10.7 | 11.6 | 11.4 | 10.4 | 10.0 | 10.1 | 10.1 |
| 18 | 20 | 22 | 24 | 27 | 30 | 34 | 37 | 41 | 50 | 51 | 52 | 53 | ||
| HgB | 9.8 | 9.1 | 9.4 | 9.4 | 9.6 | 9.6 | 9.8 | 9.6 | 9.7 | 9.4 | 9.9 | 11.2 | 10.9 | |
| Day | ||||||||||||||
|---|---|---|---|---|---|---|---|---|---|---|---|---|---|---|
| 1 | 3 | 4 | 5 | 6 | 7 | 8 | 9 | 10 | 11 | 12 | 13 | 14 | 16 | |
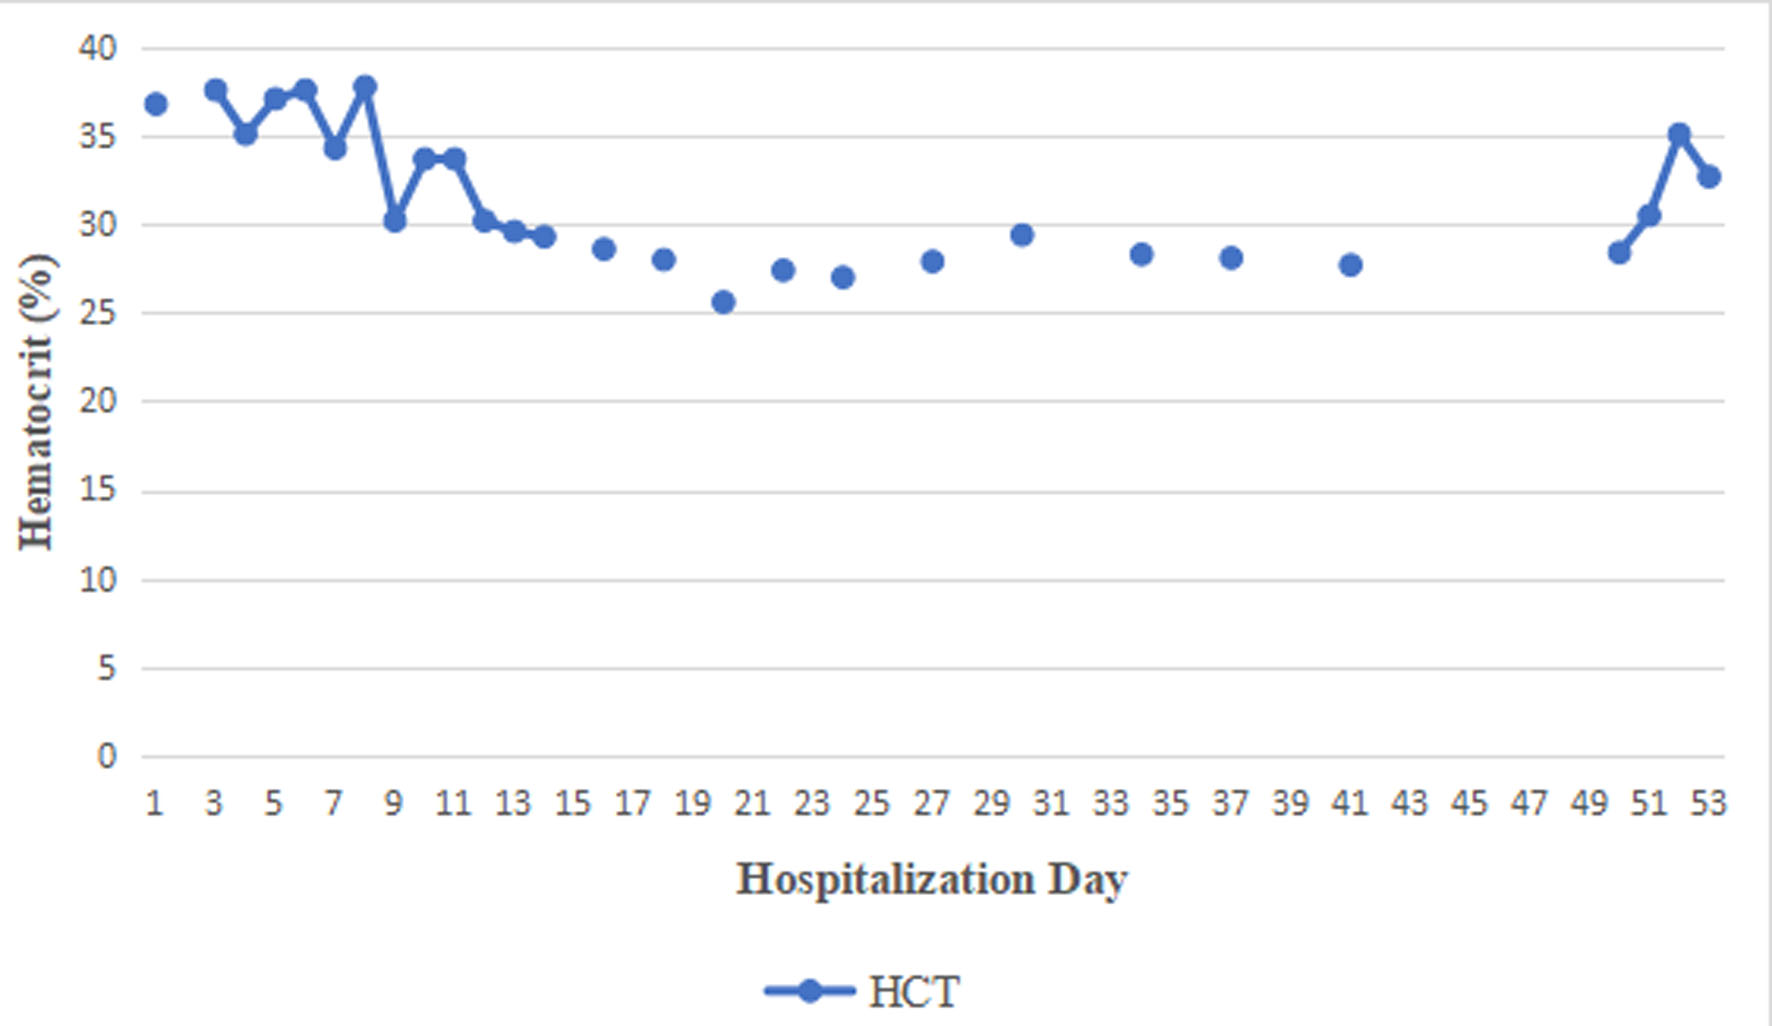
| HCT: hematocrit. | ||||||||||||||
| HCT | 36.8 | 37.6 | 35.1 | 37.1 | 37.6 | 34.3 | 37.8 | 30.2 | 33.7 | 33.7 | 30.2 | 29.6 | 29.3 | 28.6 |
| 18 | 20 | 22 | 24 | 27 | 30 | 34 | 37 | 41 | 50 | 51 | 52 | 53 | ||
| HCT | 28.0 | 25.6 | 27.4 | 27.0 | 27.9 | 29.4 | 28.3 | 28.1 | 27.7 | 28.4 | 30.5 | 35.1 | 32.7 | |
| Day | ||||||||||||||
|---|---|---|---|---|---|---|---|---|---|---|---|---|---|---|
| 1 | 3 | 4 | 5 | 6 | 7 | 8 | 9 | 10 | 11 | 12 | 13 | 14 | 16 | |
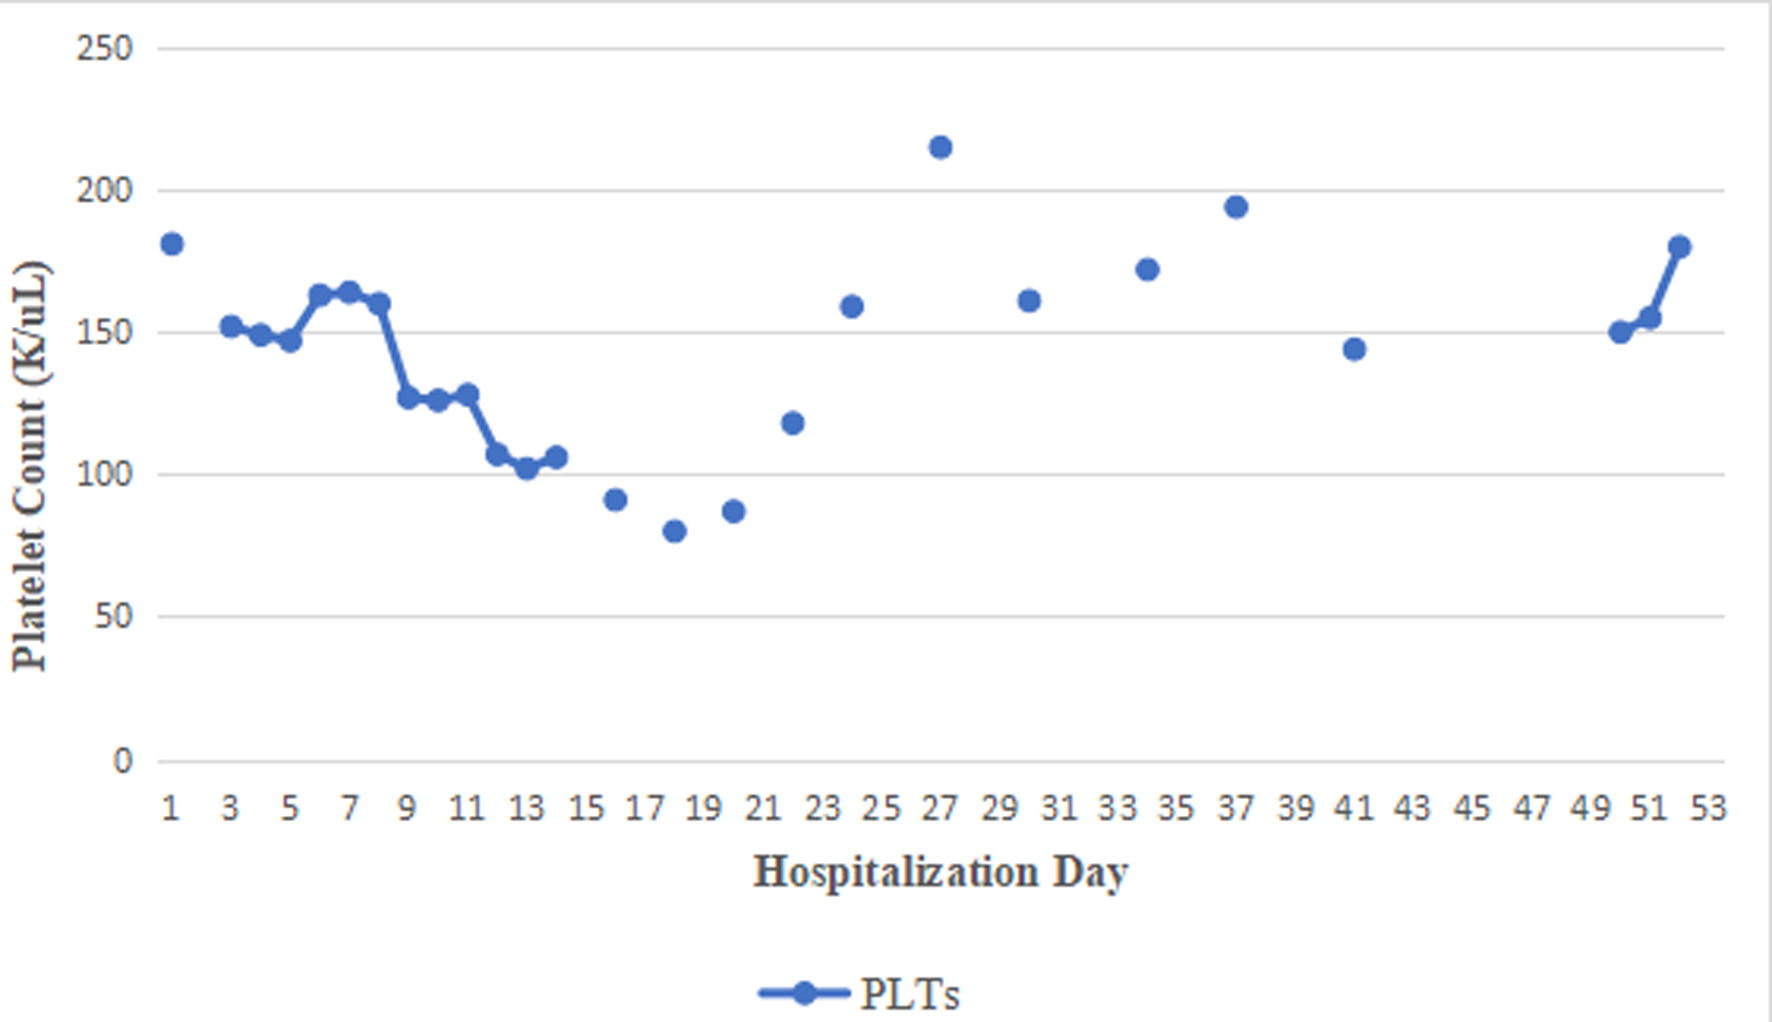
| PLT: platelet. | ||||||||||||||
| PLTs | 181 | 152 | 149 | 147 | 163 | 164 | 160 | 127 | 126 | 128 | 107 | 102 | 106 | 91 |
| 18 | 20 | 22 | 24 | 27 | 30 | 34 | 37 | 41 | 50 | 51 | 52 | 53 | ||
| PLTs | 80 | 87 | 118 | 159 | 215 | 161 | 172 | 194 | 144 | 150 | 155 | 180 | 177 | |
| Stage | Time frame | Clinical features | Laboratory/organ findings |
|---|---|---|---|
| CNS: central nervous system; PT: prothrombin time. | |||
| Stage I | 30 min to 24 h | Possibly asymptomatic; nausea, vomiting, diaphoresis, pallor, lethargy, malaise | Transaminases usually normal (may rise after 8–12 h in large ingestions); possible CNS depression and high anion gap metabolic acidosis |
| Stage II | 24–72 h | Apparent clinical improvement; right upper quadrant pain; hepatomegaly | Rising transaminases; worsening labs despite clinical improvement; increased PT and bilirubin; possible renal injury/oliguria; rare acute pancreatitis |
| Stage III | 72–96 h | Severe symptoms: jaundice, encephalopathy, bleeding tendency; recurrence of early symptoms | Peak aminotransferases (> 10,000 IU/L); hyperammonemia; prolonged PT; hypoglycemia; lactic acidosis; indirect hyperbilirubinemia; acute renal failure common; highest mortality risk (multisystem organ failure) |
| Stage IV | ≥ Day 4 (recovery phase) | Clinical recovery if survival of stage III | Gradual normalization of labs (weeks); histopathologic liver changes evident; typically, no long-term liver dysfunction or cirrhosis |
| System/complication | Supportive measures |
|---|---|
| FFP: fresh frozen plasma; ICP: intracranial pressure; ICU: intensive care unit. | |
| General/ICU care | Continuous monitoring of vital signs, neurological status, labs; manage fluids and electrolytes; ICU admission required |
| Hemodynamic | Maintain blood pressure and organ perfusion; use fluids and vasopressors as needed; avoid fluid overload |
| Cerebral edema/intracranial hypertension | Elevate head of bed, normothermia, sedation; osmotic therapy (mannitol) if ICP rises; avoid hypercapnia and hyponatremia |
| Coagulation | Correct only if active bleeding or invasive procedures; routine prophylaxis not recommended; use FFP/platelets selectively |
| Renal | Monitor kidney function; initiate renal replacement therapy for severe metabolic derangements or volume overload |
| Infection | Frequent microbiological monitoring: prompt antibiotic/antifungal therapy if infection develops |
| Metabolic/nutrition | Maintain glucose homeostasis; enteral nutrition preferred; parenteral if enteral contraindicated |
| Respiratory | Mechanical ventilation if severe encephalopathy or respiratory failure develops |