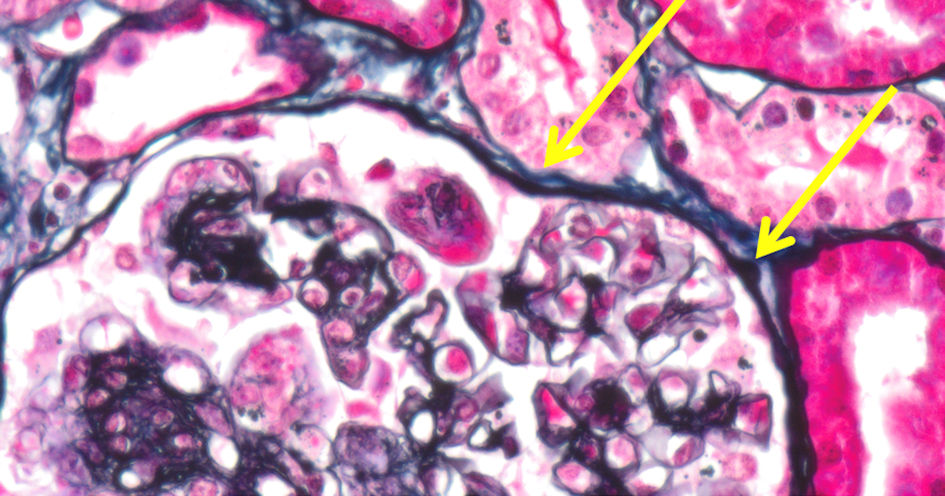
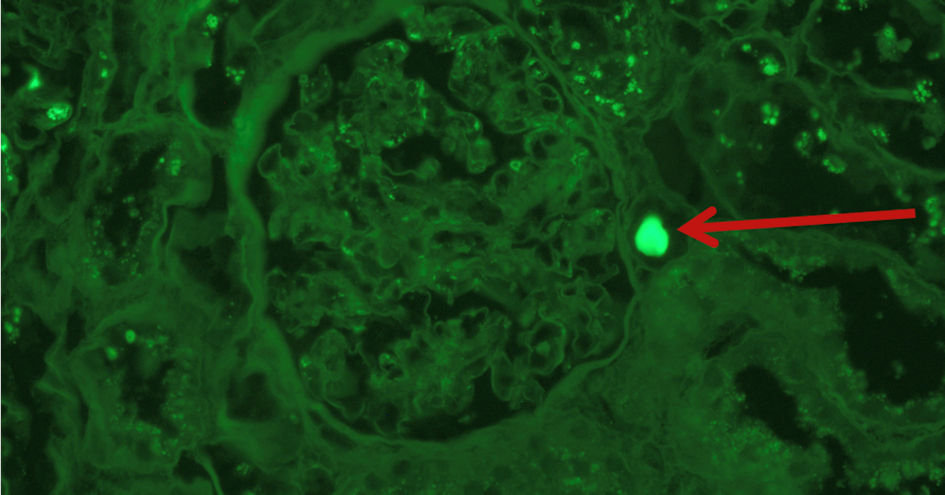
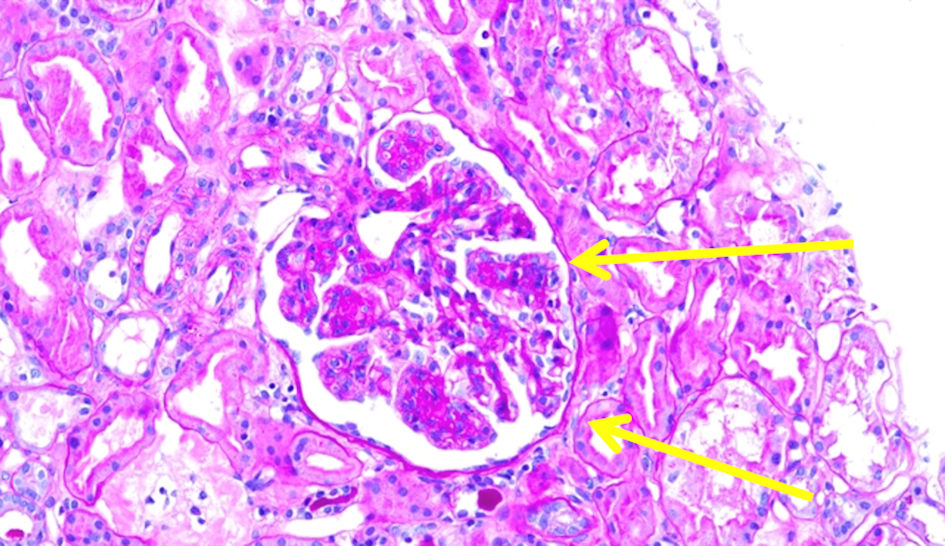
↓ Figure 1. Intraluminal cryoglobulin deposits (yellow arrows).
| Journal of Medical Cases, ISSN 1923-4155 print, 1923-4163 online, Open Access |
| Article copyright, the authors; Journal compilation copyright, J Med Cases and Elmer Press Inc |
| Journal website https://jmc.elmerpub.com |
Case Report
Volume 17, Number 9, September 2026, pages 464-469
The Hidden Link: Cryoglobulinemic Membranoproliferative Glomerulonephritis Secondary to Monoclonal Gammopathy of Renal Significance
Figures
Tables
| Serum | Patient values | Reference range |
|---|---|---|
| CBC: complete blood count; CMP: comprehensive metabolic panel; ALT: alanine aminotransferase; AST: aspartate aminotransferase; eGFR: estimated glomerular filtration rate; TIBC: total iron-binding capacity; BUN: blood urea nitrogen; WBC: white blood cell. | ||
| WBC count | 4.87 | 4,000–11,000 |
| Hemoglobin | 11.5 | 12.0–15.5 g/dL |
| Platelet count | 303 | 150,000–450,000/µL |
| Anion gap | 10.5 | 4–12 mEq/L |
| Sodium | 141 | 135–145 mEq/L |
| Potassium | 5.2 | 3.6–5.2 mEq/L |
| Chloride | 105 | 96-106 mEq/L |
| CO2 | 25.4 | 23–29 mmol/L |
| Calcium level | 9.8 | 8.5–10.5 mg/dL |
| BUN | 35.6 | 6–20 mg/dL |
| Creatinine | 1.7 | 0.5–1.1 mg/dL |
| Glucose | 63 | 70–99 mg/dL |
| Protein | 6.8 | 6.0–8.3 g/dL |
| Albumin | 4.4 | 3.4–5.4 g/dL |
| Globulin | 2.5 | 2.0–3.5 g/dL |
| ALT | 19 | 4–36 U/L |
| AST | 22 | 8–33 U/L |
| Alkaline phosphatase | 84 | 44–147 IU/L |
| Bilirubin total | 0.9 | 0.1–1.2 mg/dL |
| eGFR | 33 | > 90 |
| Ferritin | 95.9 | 30–400 ng/mL |
| Iron | 63 | 50–170 µg/dL |
| TIBC | 300 | 149–492 µg/dL |
| Transferrin | 214 | 250–450 µg/dL |
| Urine | Patient values | Reference range |
|---|---|---|
| UA: urinalysis; RBC: red blood cell; HPF: high-power field. | ||
| UA color | Yellow | Clear to pale yellow |
| UA appearance | Clear | Clear |
| UA PH | 5 | 4.6–8.0 |
| UA specific gravity | 1.013 | 1.005–1.030 |
| UA bilirubin | Negative | Negative |
| UA blood | Trace | 0–2 RBCs/HPF |
| UA glucose | 250 | 0–0.8 mmol/L |
| UA ketones | Negative | < 0.6 mmol/L |
| UA leukocyte esterase | Trace | Negative |
| UA nitrite | Negative | Negative |
| UA protein | Trace | 150 mg/day |
| UA urobilinogen | 0.2 | UA urobilinogen |
| Urine creatinine | 60.1 | 0.8–2.0 g/day |
| Urine microalbumin/creatinine ratio | 191 | < below 30 mg/g |
| Urine microalbumin | 11.5 | < 30 mg/day |
| Urine protein | 23.2 | < 150 mg/day |
| Urine protein/creatinine ratio | 0.38 | < 0.2 mg/mg |
| Serum | Patient values | Reference range |
|---|---|---|
| Kappa free light chain | 10.37 | 3.3–19.4 mg/L |
| Lambda free light chain | 1.75 | 5.7–26.3 mg/L |
| Kappa/lambda FLC ratio | 5.93 | 0.26–1.65 |
| Calculated albumin | 4.28 | 3.5–5.0 g/dL |
| Urine protein electrophoresis | No Bence jones proteins | Albumin |
| Serum | Patient values | Reference range |
|---|---|---|
| ANA: antinuclear antibody; Ig: immunoglobulin. | ||
| ANA screen | Negative | Negative |
| Glomerular basement membrane IgG | Negative | < 7.0 U/mL |
| Myeloperoxidase antibody | Negative | < 0.4 U |
| Proteinase 3 | Negative | < 2 IU/mL |
| Quantitative rheumatoid arthritis factor | < 10 | < 14 IU/mL |
| C3 complement | 76.8 | 88–201 mg/dL |
| C4 complement | 13.7 | 15–45 mg/dL |
| IgA | 82.9 | 70–400 mg/dL |
| IgG | 1,042.00 | 600–1,600 mg/dL |
| IgM | 333 | 40–250 mg/dL |