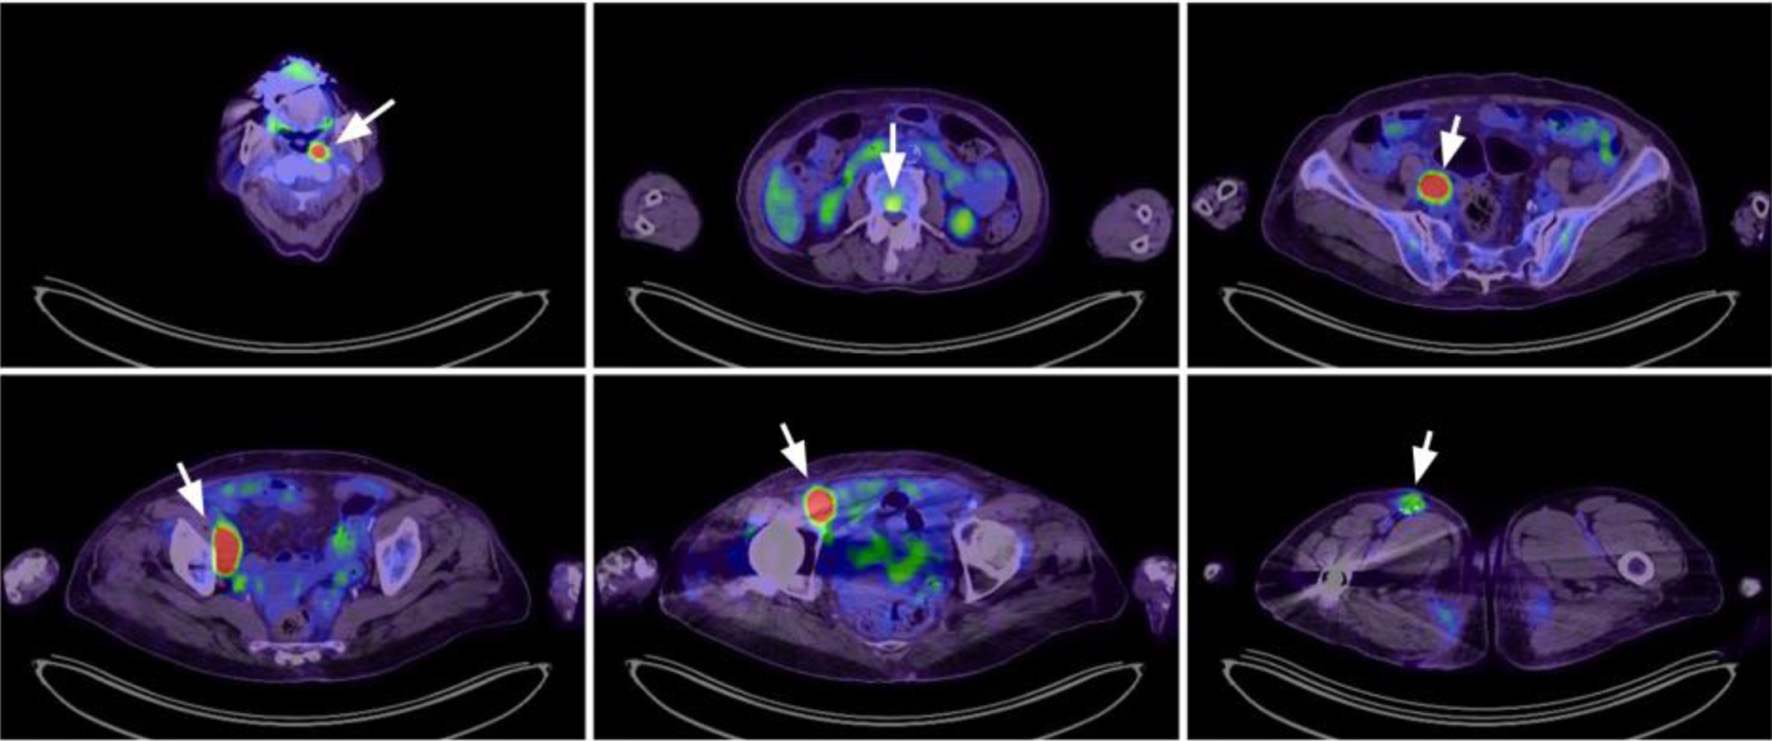
↓ Figure 1. Positron emission tomography scan at diagnosis revealed lymphoma involvement at multiple nodal areas (left nasopharyngeal, right iliac, right femoral) and vertebral spine (arrowheads).
| Journal of Medical Cases, ISSN 1923-4155 print, 1923-4163 online, Open Access |
| Article copyright, the authors; Journal compilation copyright, J Med Cases and Elmer Press Inc |
| Journal website https://jmc.elmerpub.com |
Case Report
Volume 17, Number 5, May 2026, pages 231-237
Challenges of Hepatitis B Virus Reactivation and CD19 Testing Following Tafasitamab Plus Lenalidomide for Relapsed Diffuse Large B-Cell Lymphoma
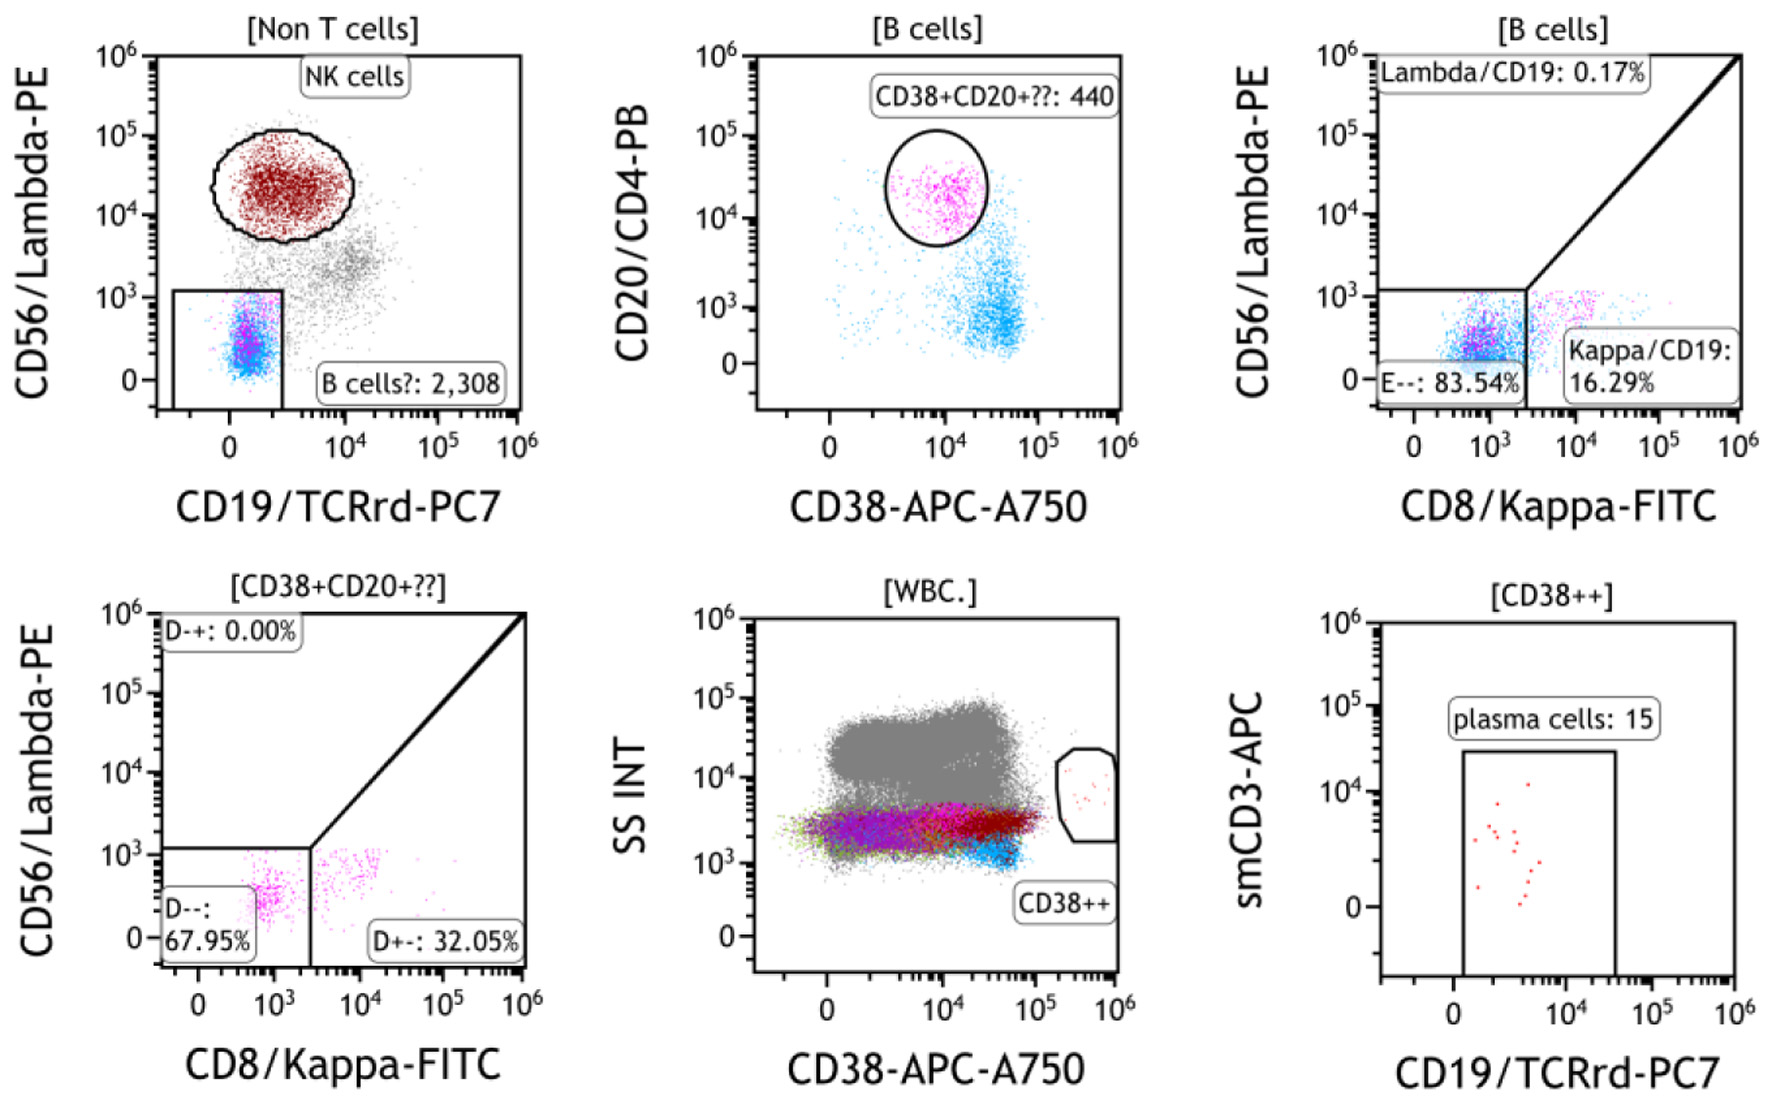
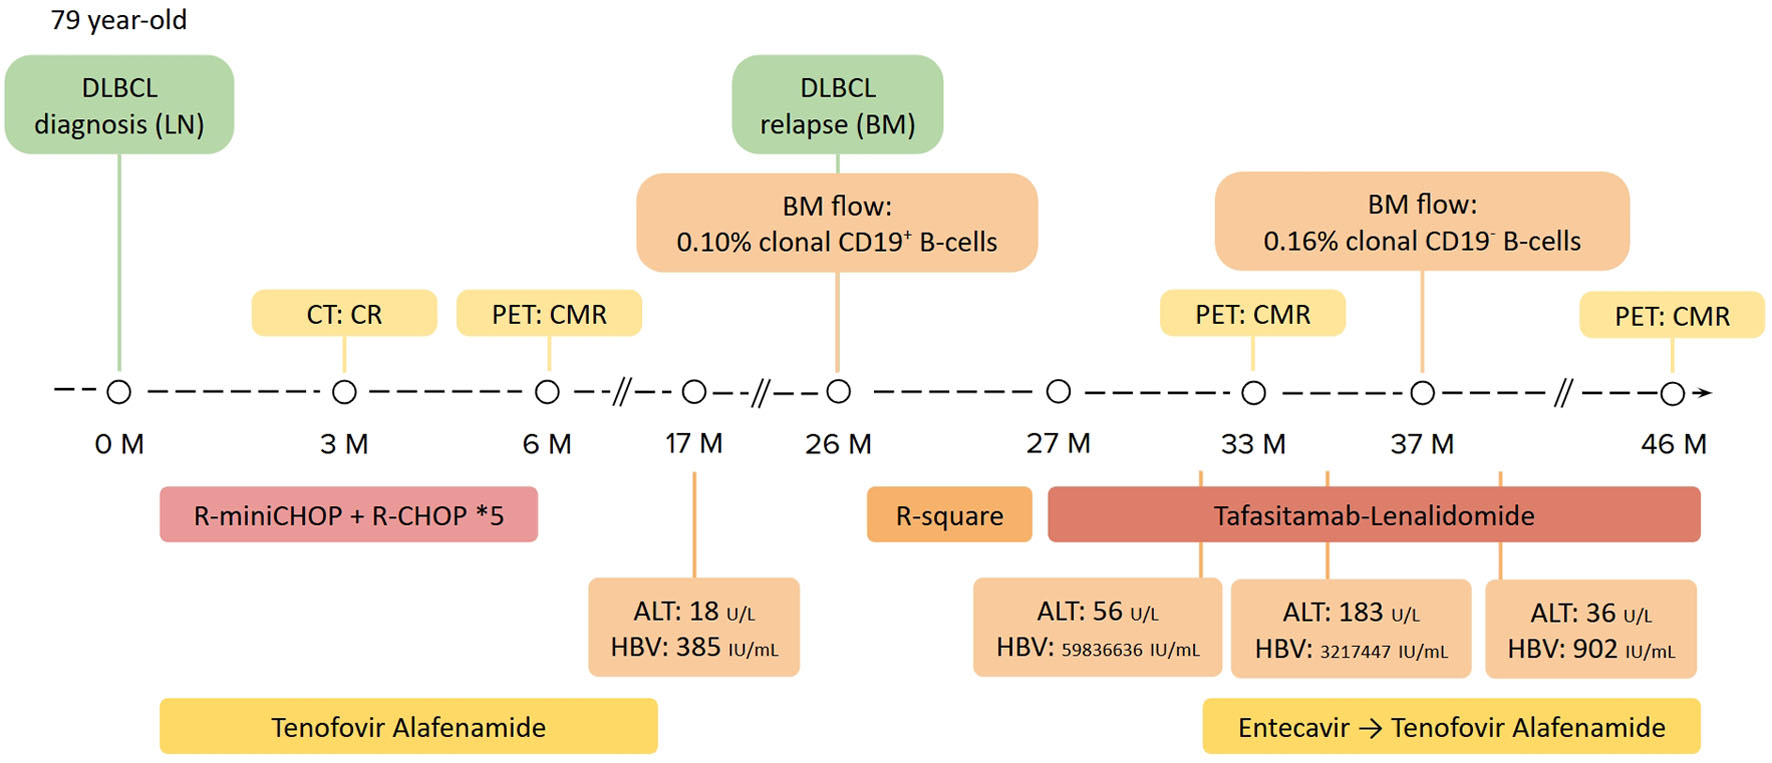
Figures