Figures
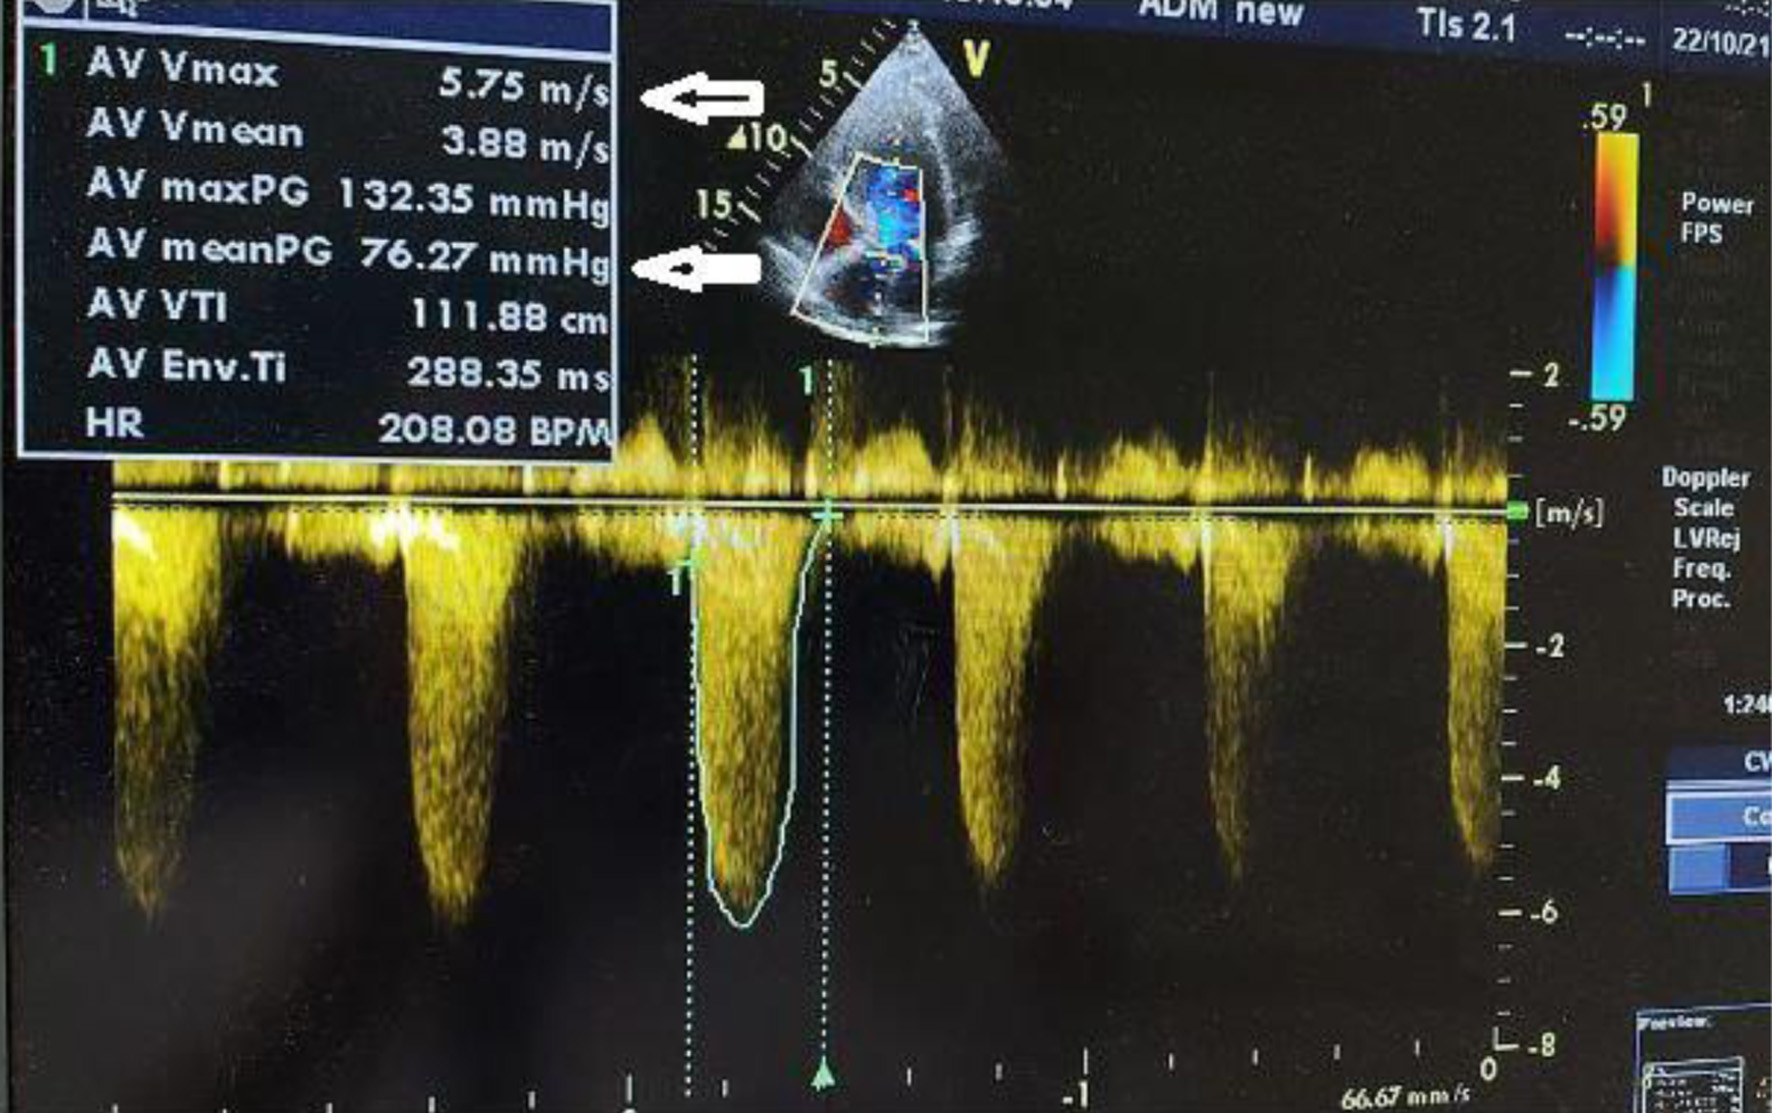
↓ Figure 1. Severe aortic stenosis with a transvalvular mean gradient of 76 mm Hg and maximal velocity of 5.75 m/s (arrows indicates transvalvular mean gradient and maximal velocity).
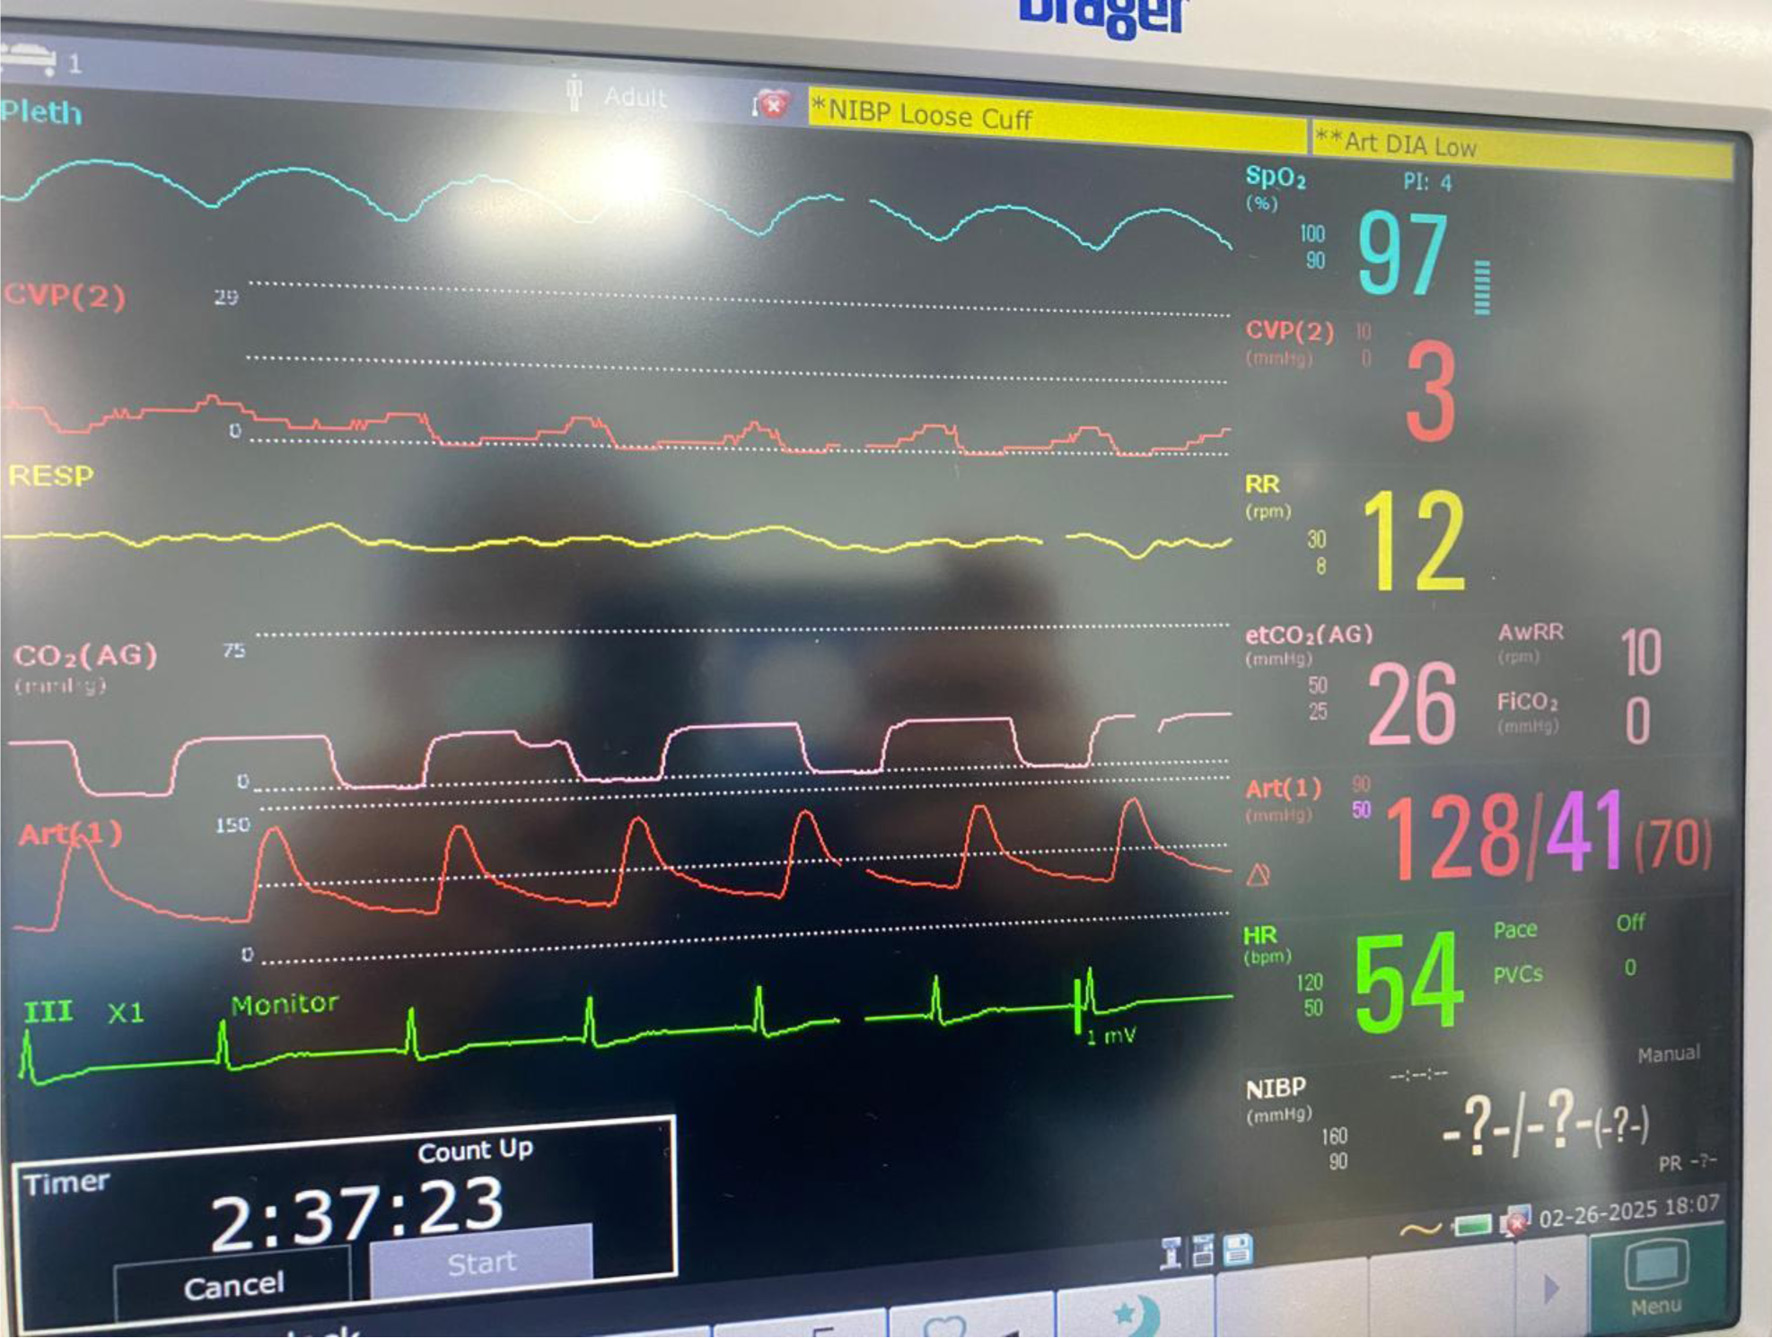
↓ Figure 2. Intraoperative monitoring in accordance with ASA standards, including invasive arterial blood pressure and central venous pressure monitoring.
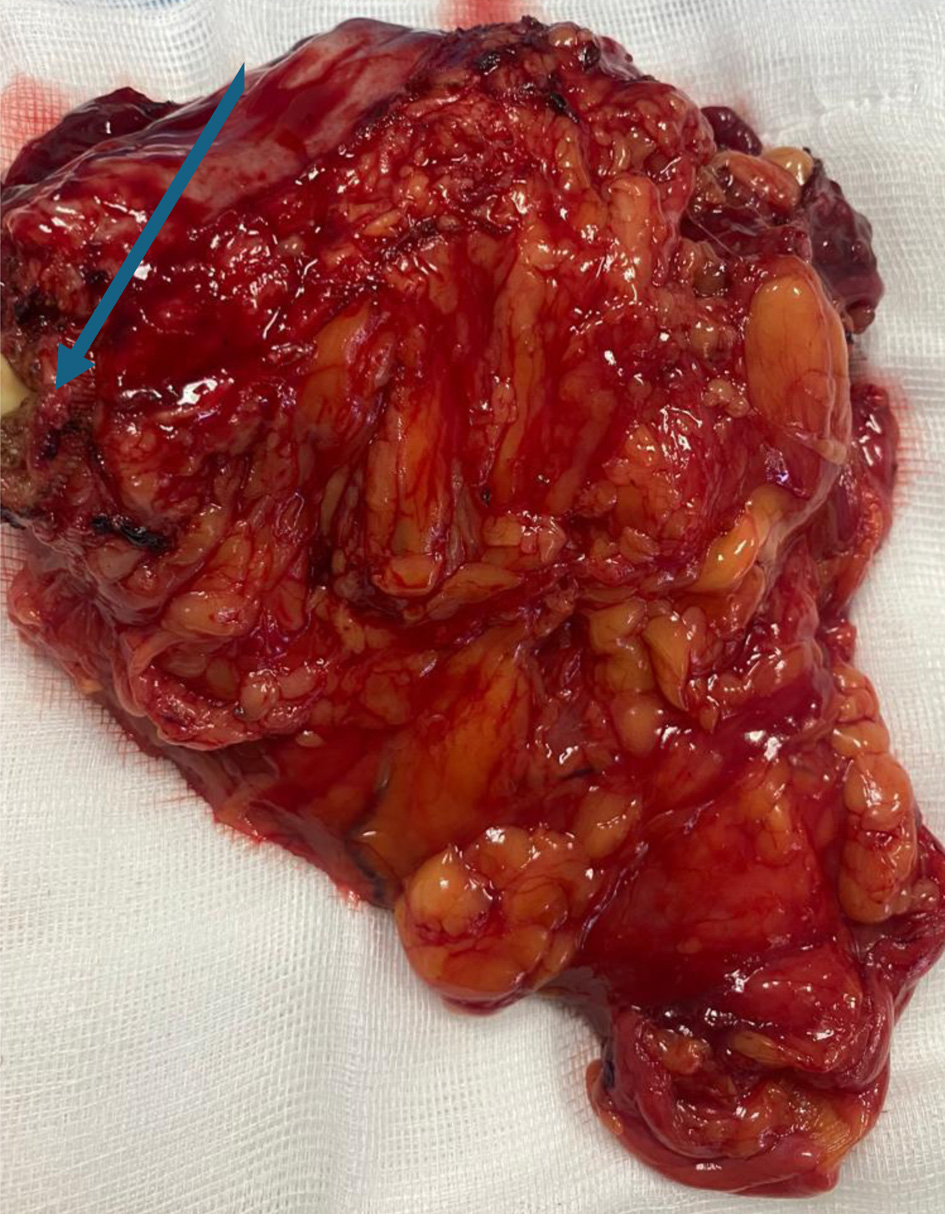
↓ Figure 3. Right radical nephroureterectomy (arrow indicates the ureter).
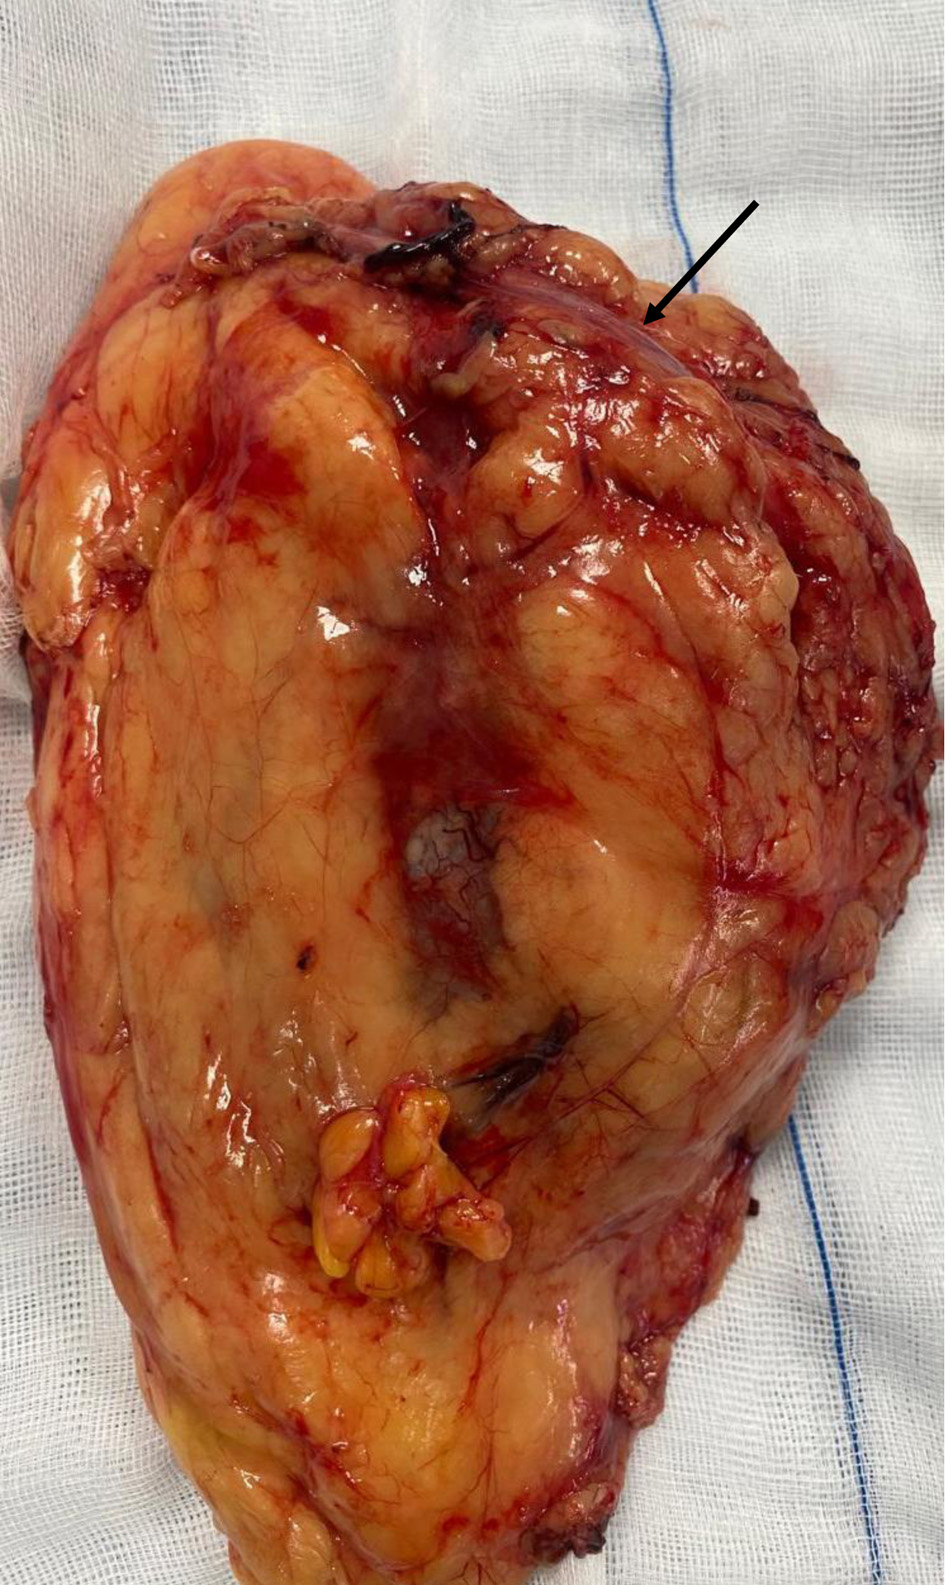
↓ Figure 4. Cystectomy and total hysterectomy with bilateral salpingo-oophorectomy (arrow indicating the urinary bladder neck, and the bladder is visible; the uterus is located beneath the urinary bladder).
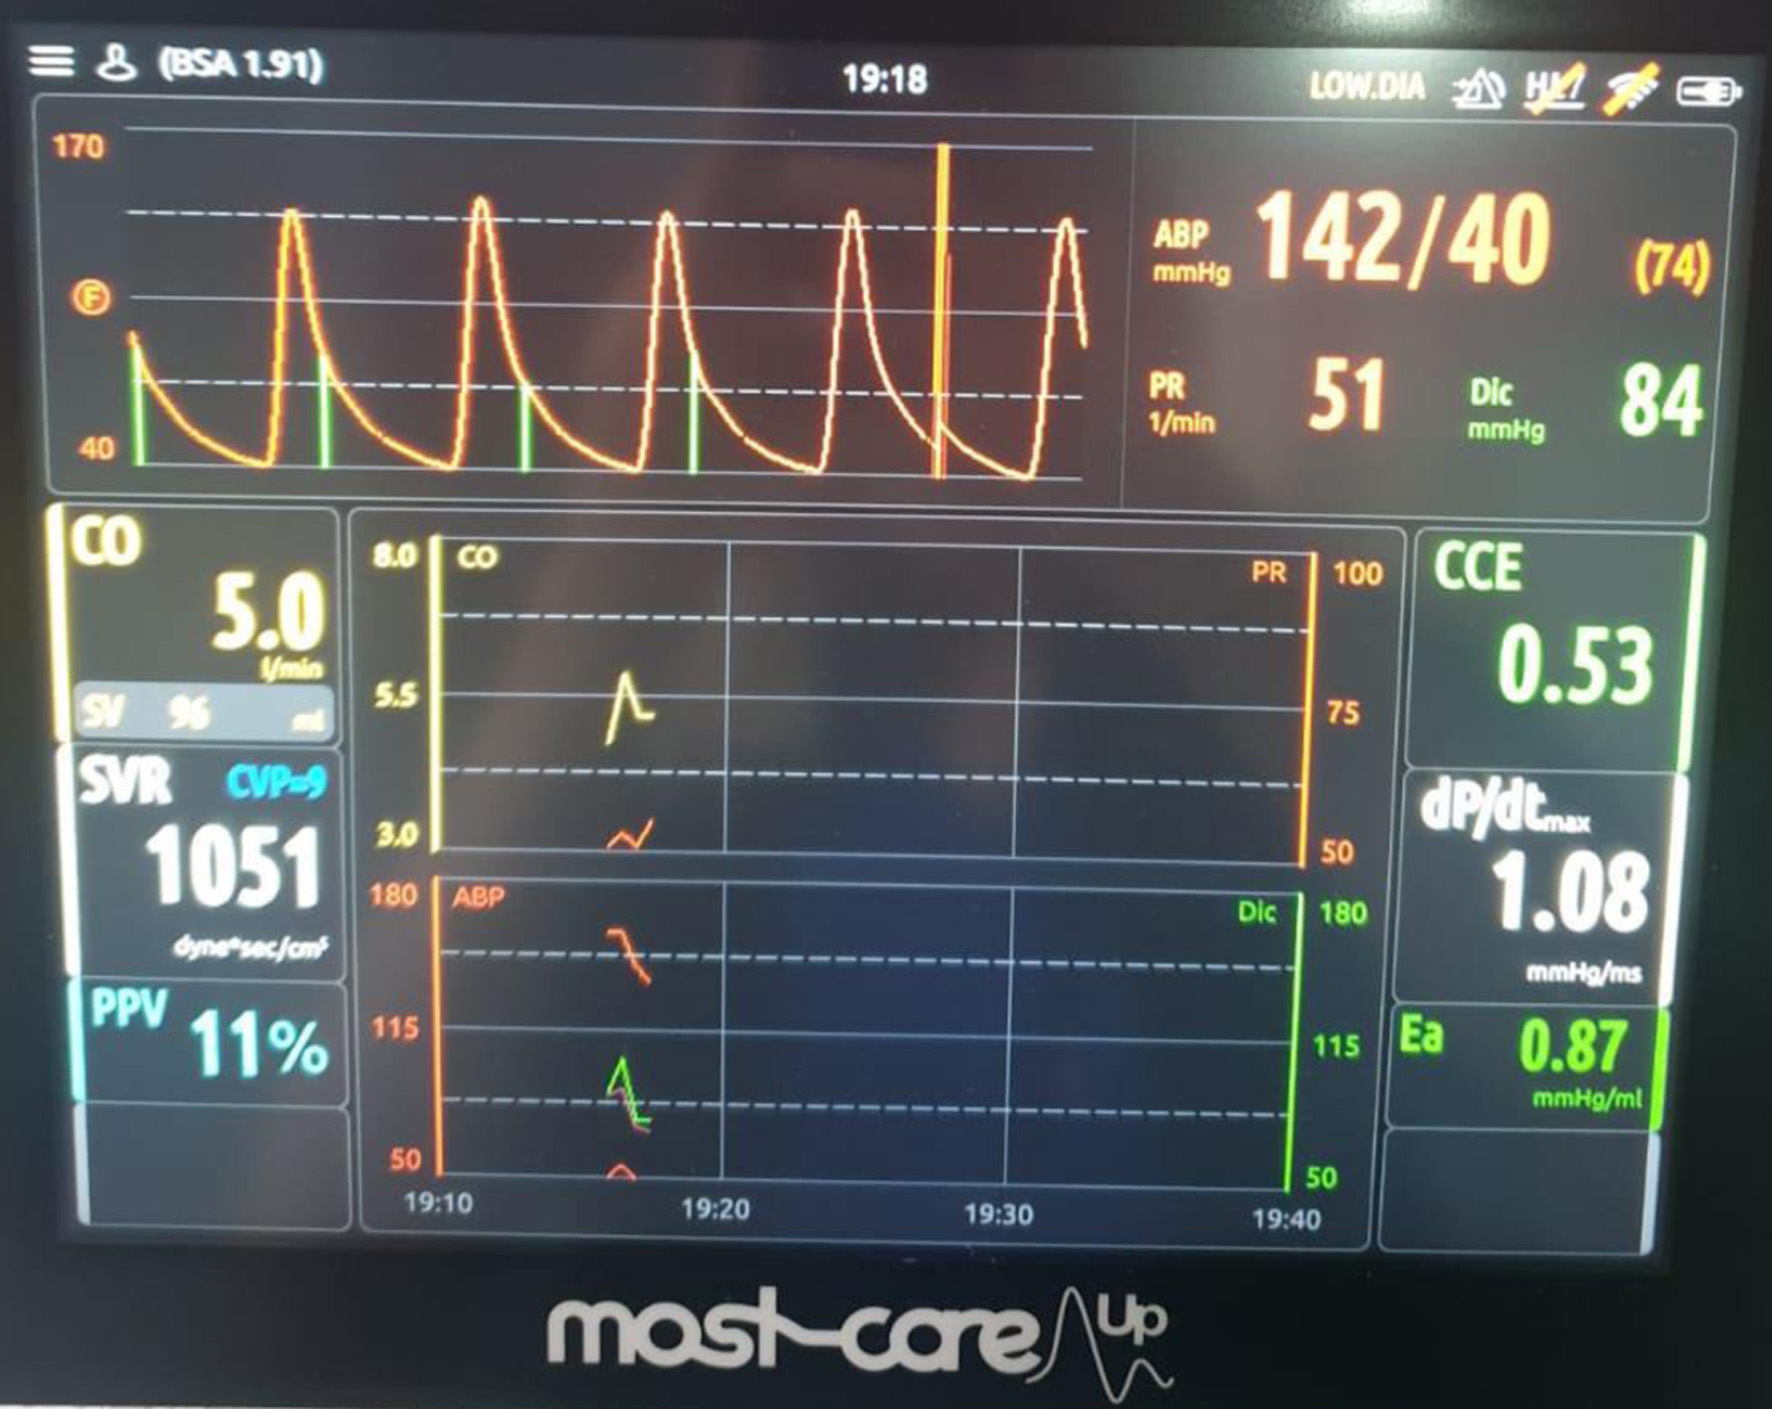
↓ Figure 5. MOST-CARE hemodynamic monitoring during the postoperative period in the intensive care unit, demonstrating cardiac output (CO), stroke volume (SV), systemic vascular resistance (SVR), and pulse pressure variation (PPV) used to guide hemodynamic optimization.
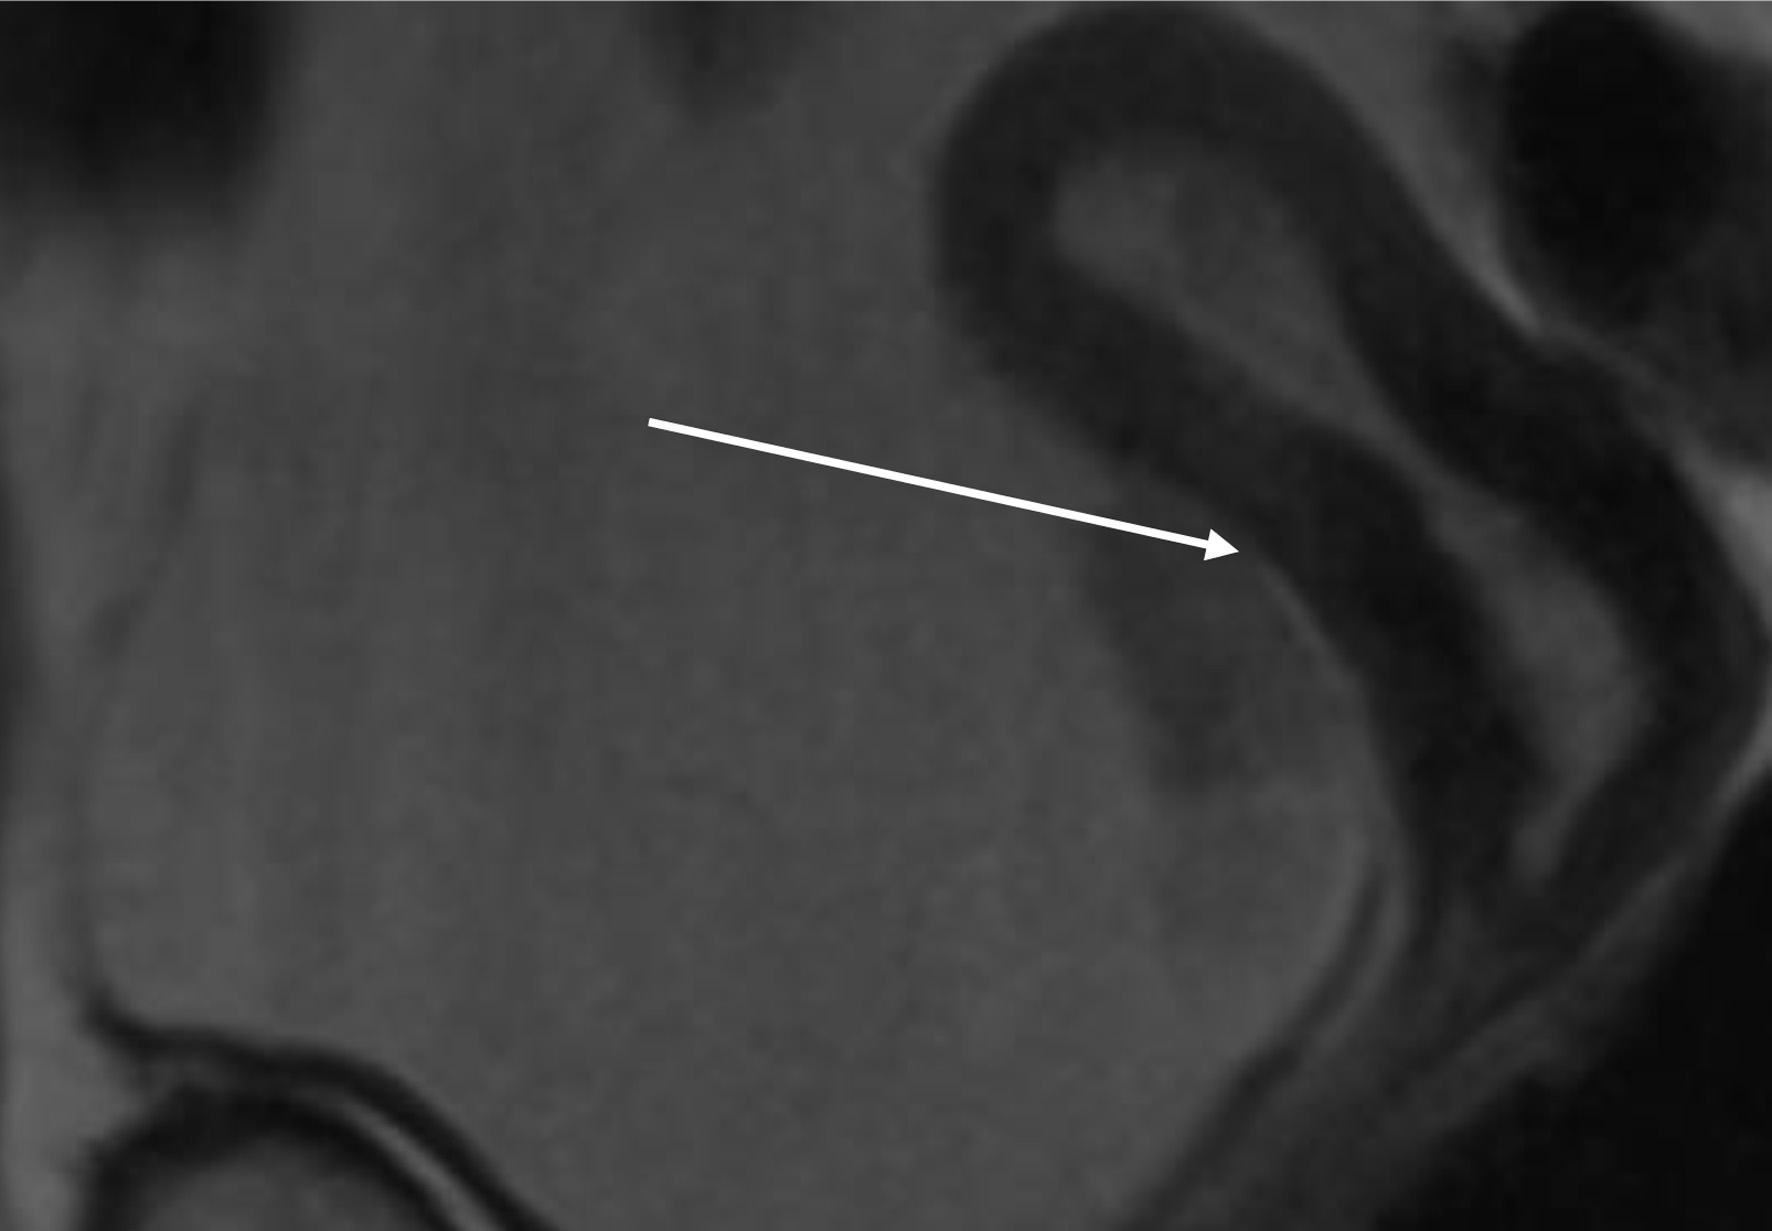
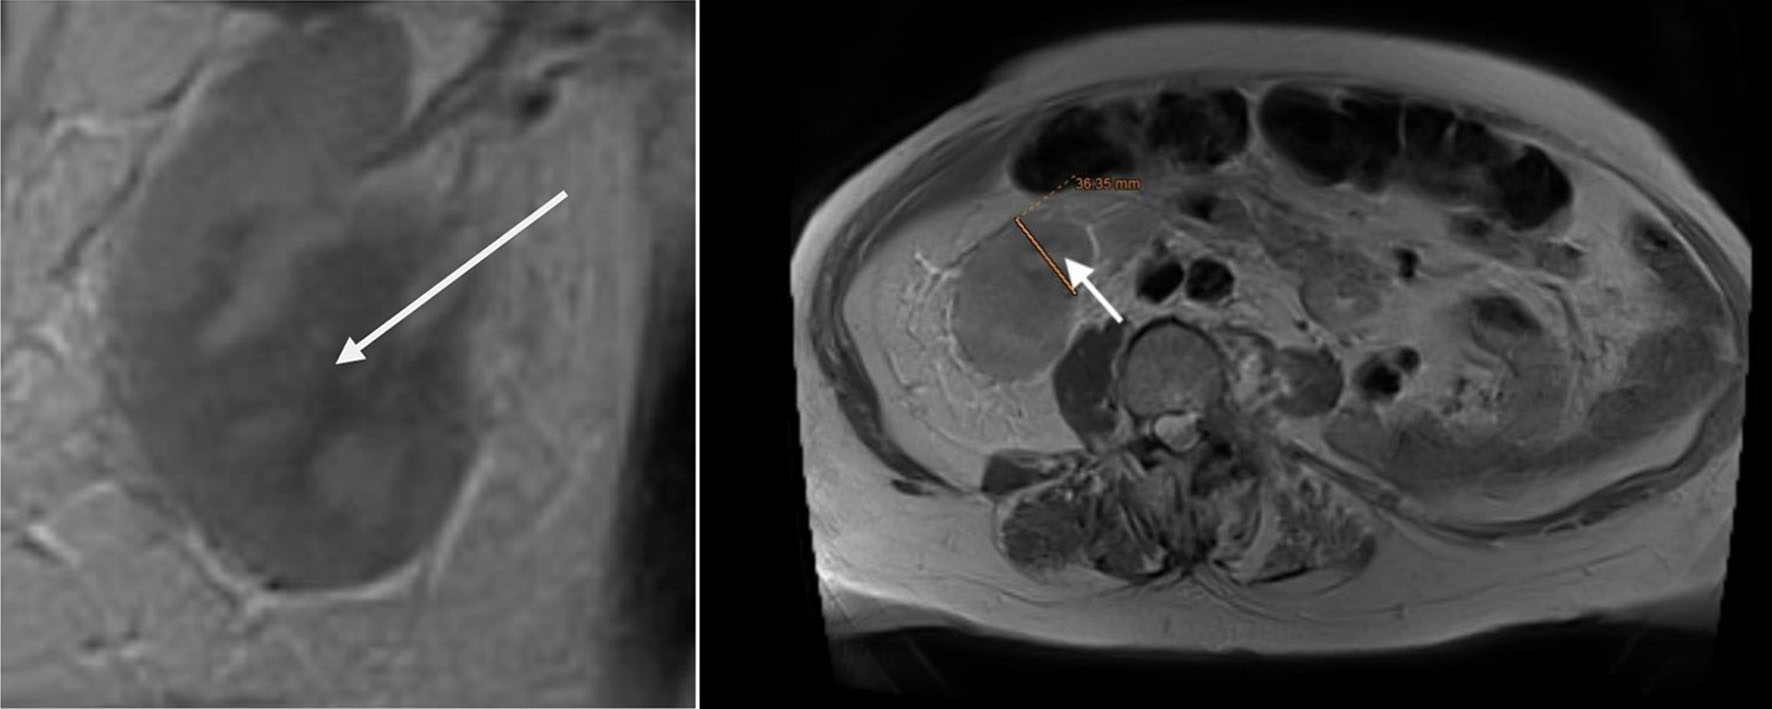
↓ Figure 6. Lower abdomen magnetic resonance imaging (MRI) examination demonstrated tumor invading ureter (arrow).
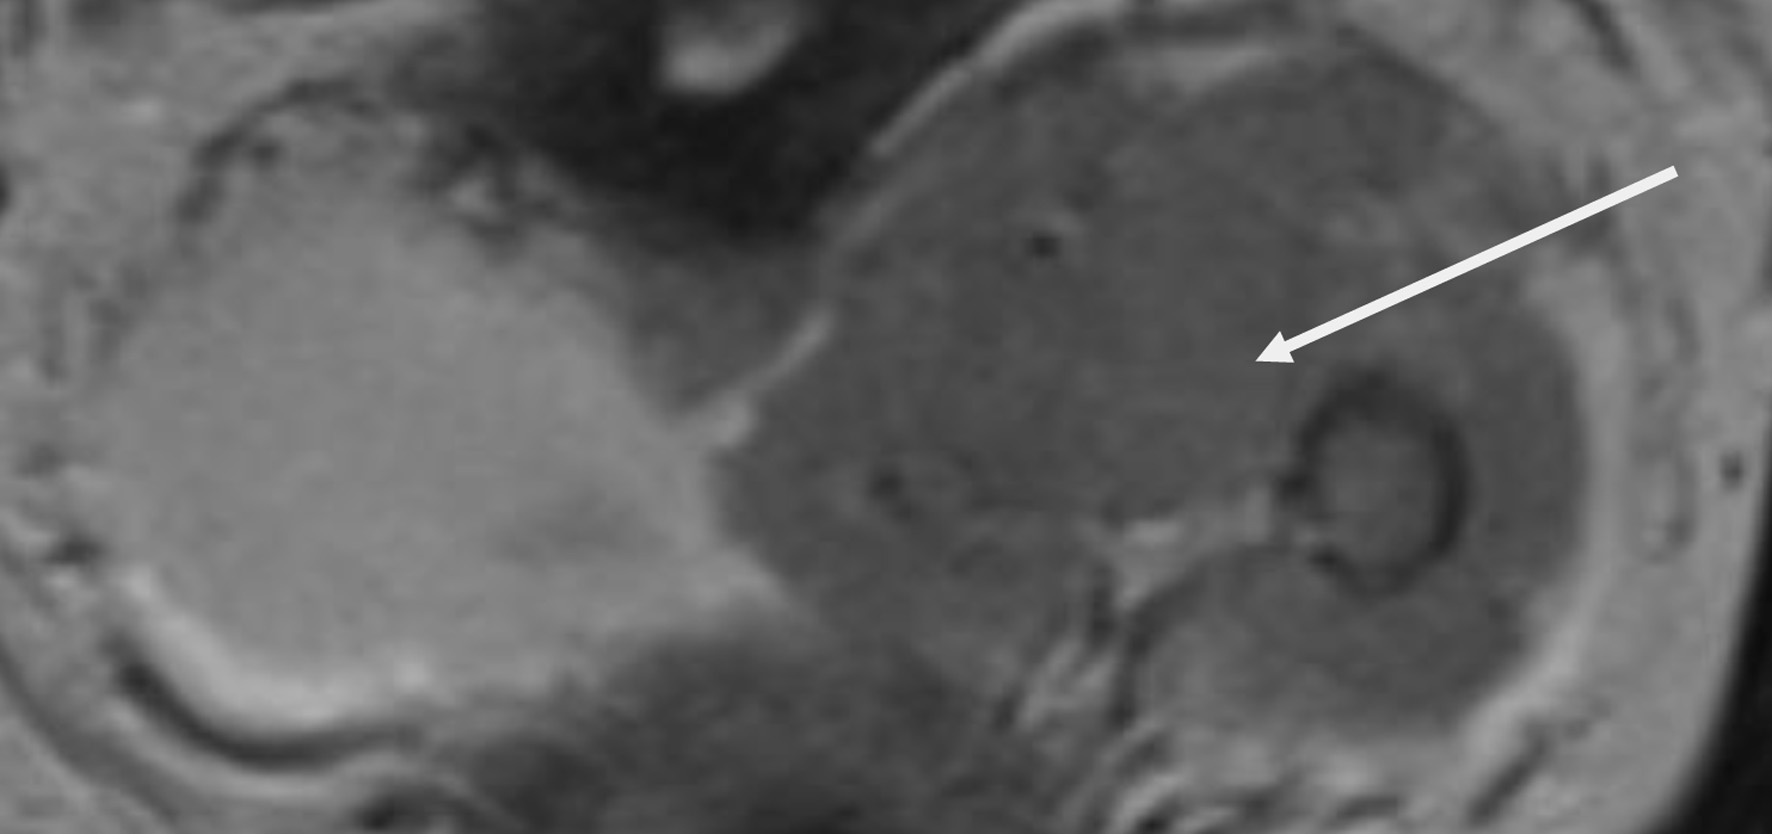
↓ Figure 7. Upper abdomen magnetic resonance imaging (MRI) examination demonstrated tumor invading renal parenchyma (arrow).
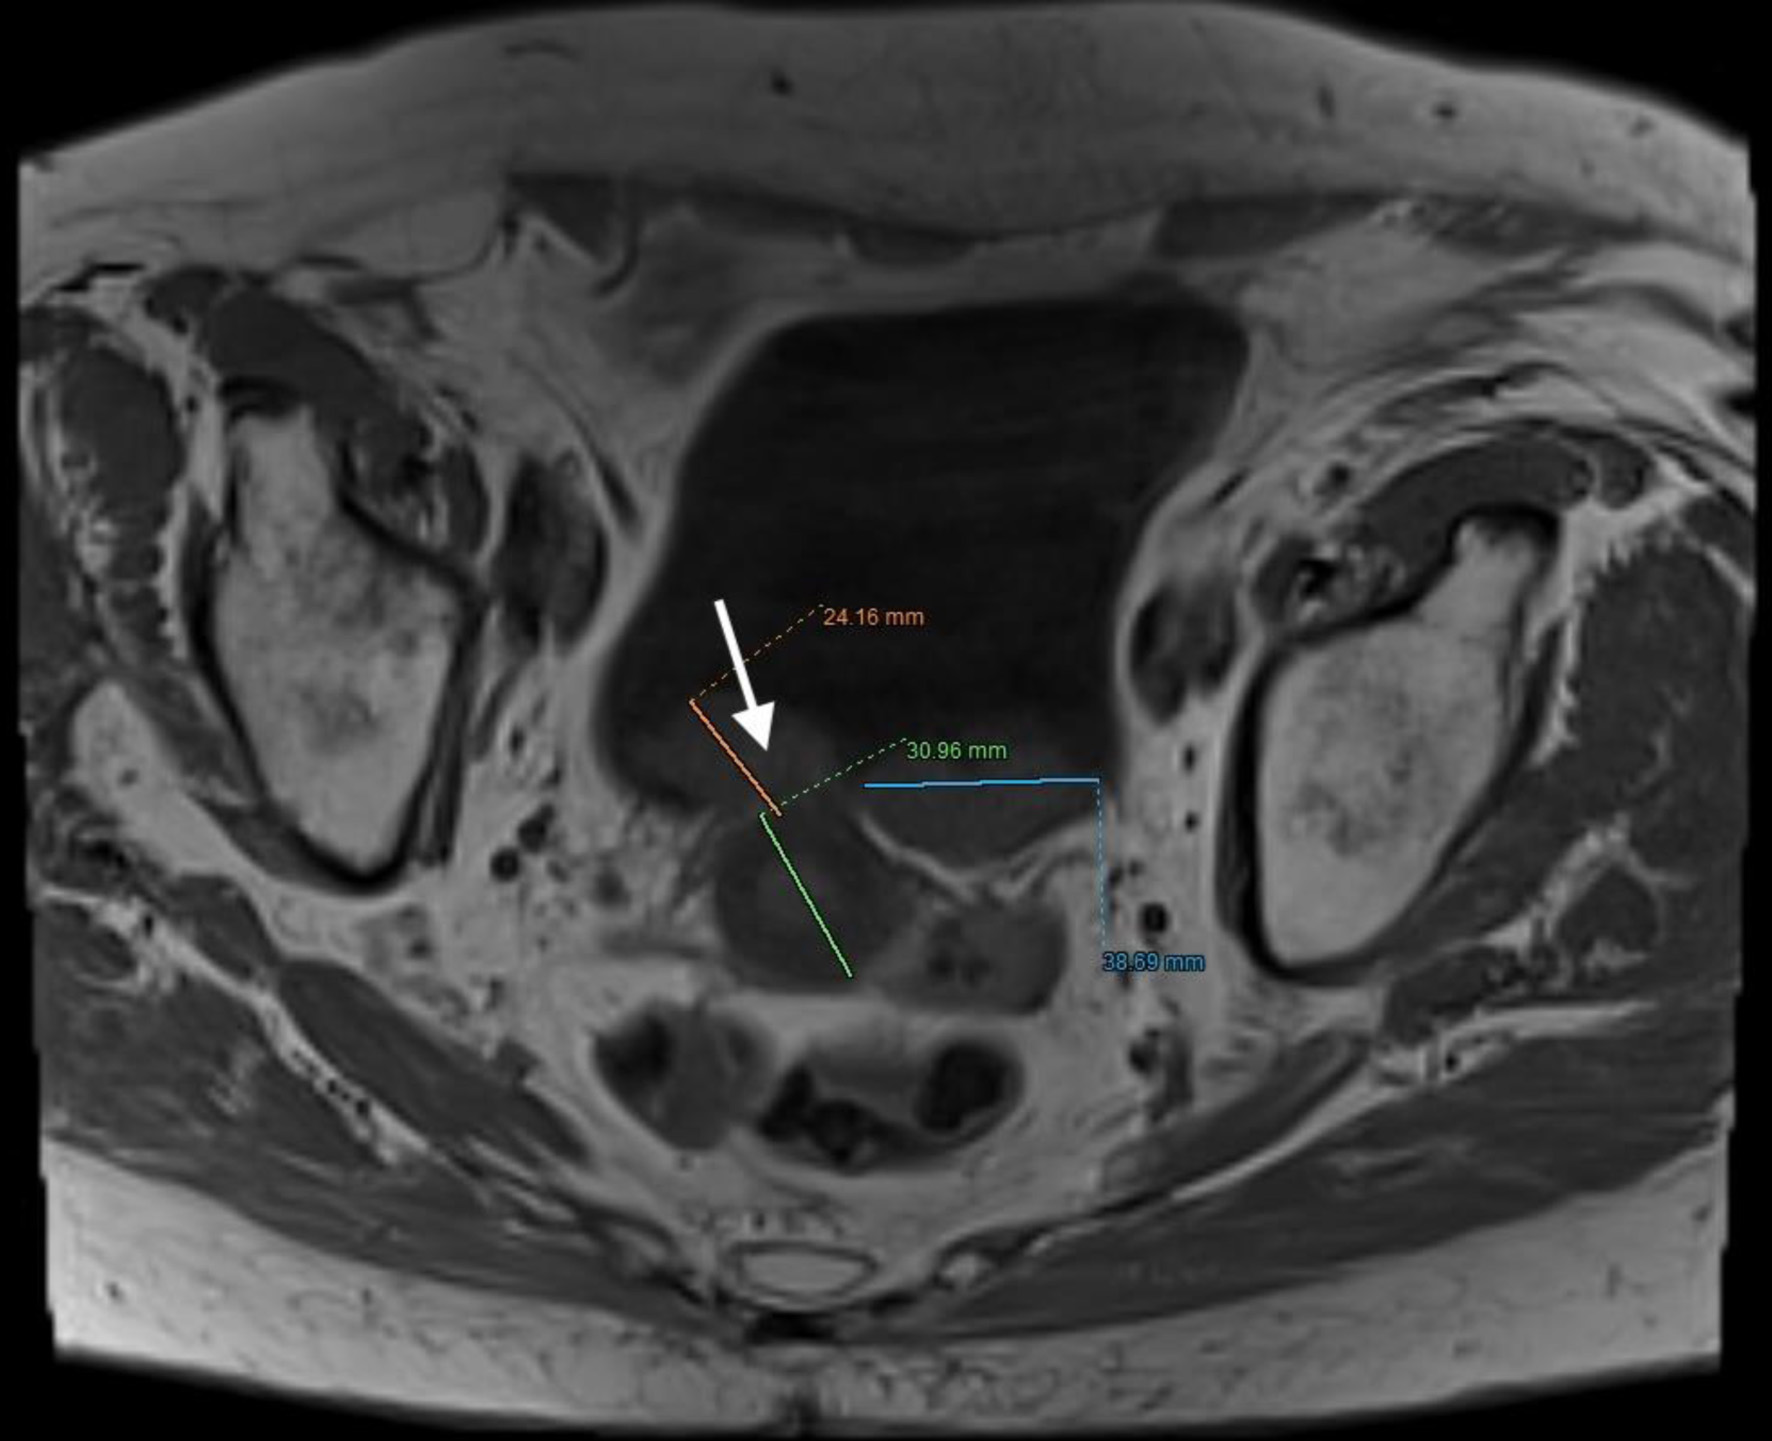
↓ Figure 8. Lower abdominal magnetic resonance imaging (MRI) revealed a vegetative, infiltrative lesion invading the surrounding adipose tissue and occupying the urinary bladder cavity (arrow).
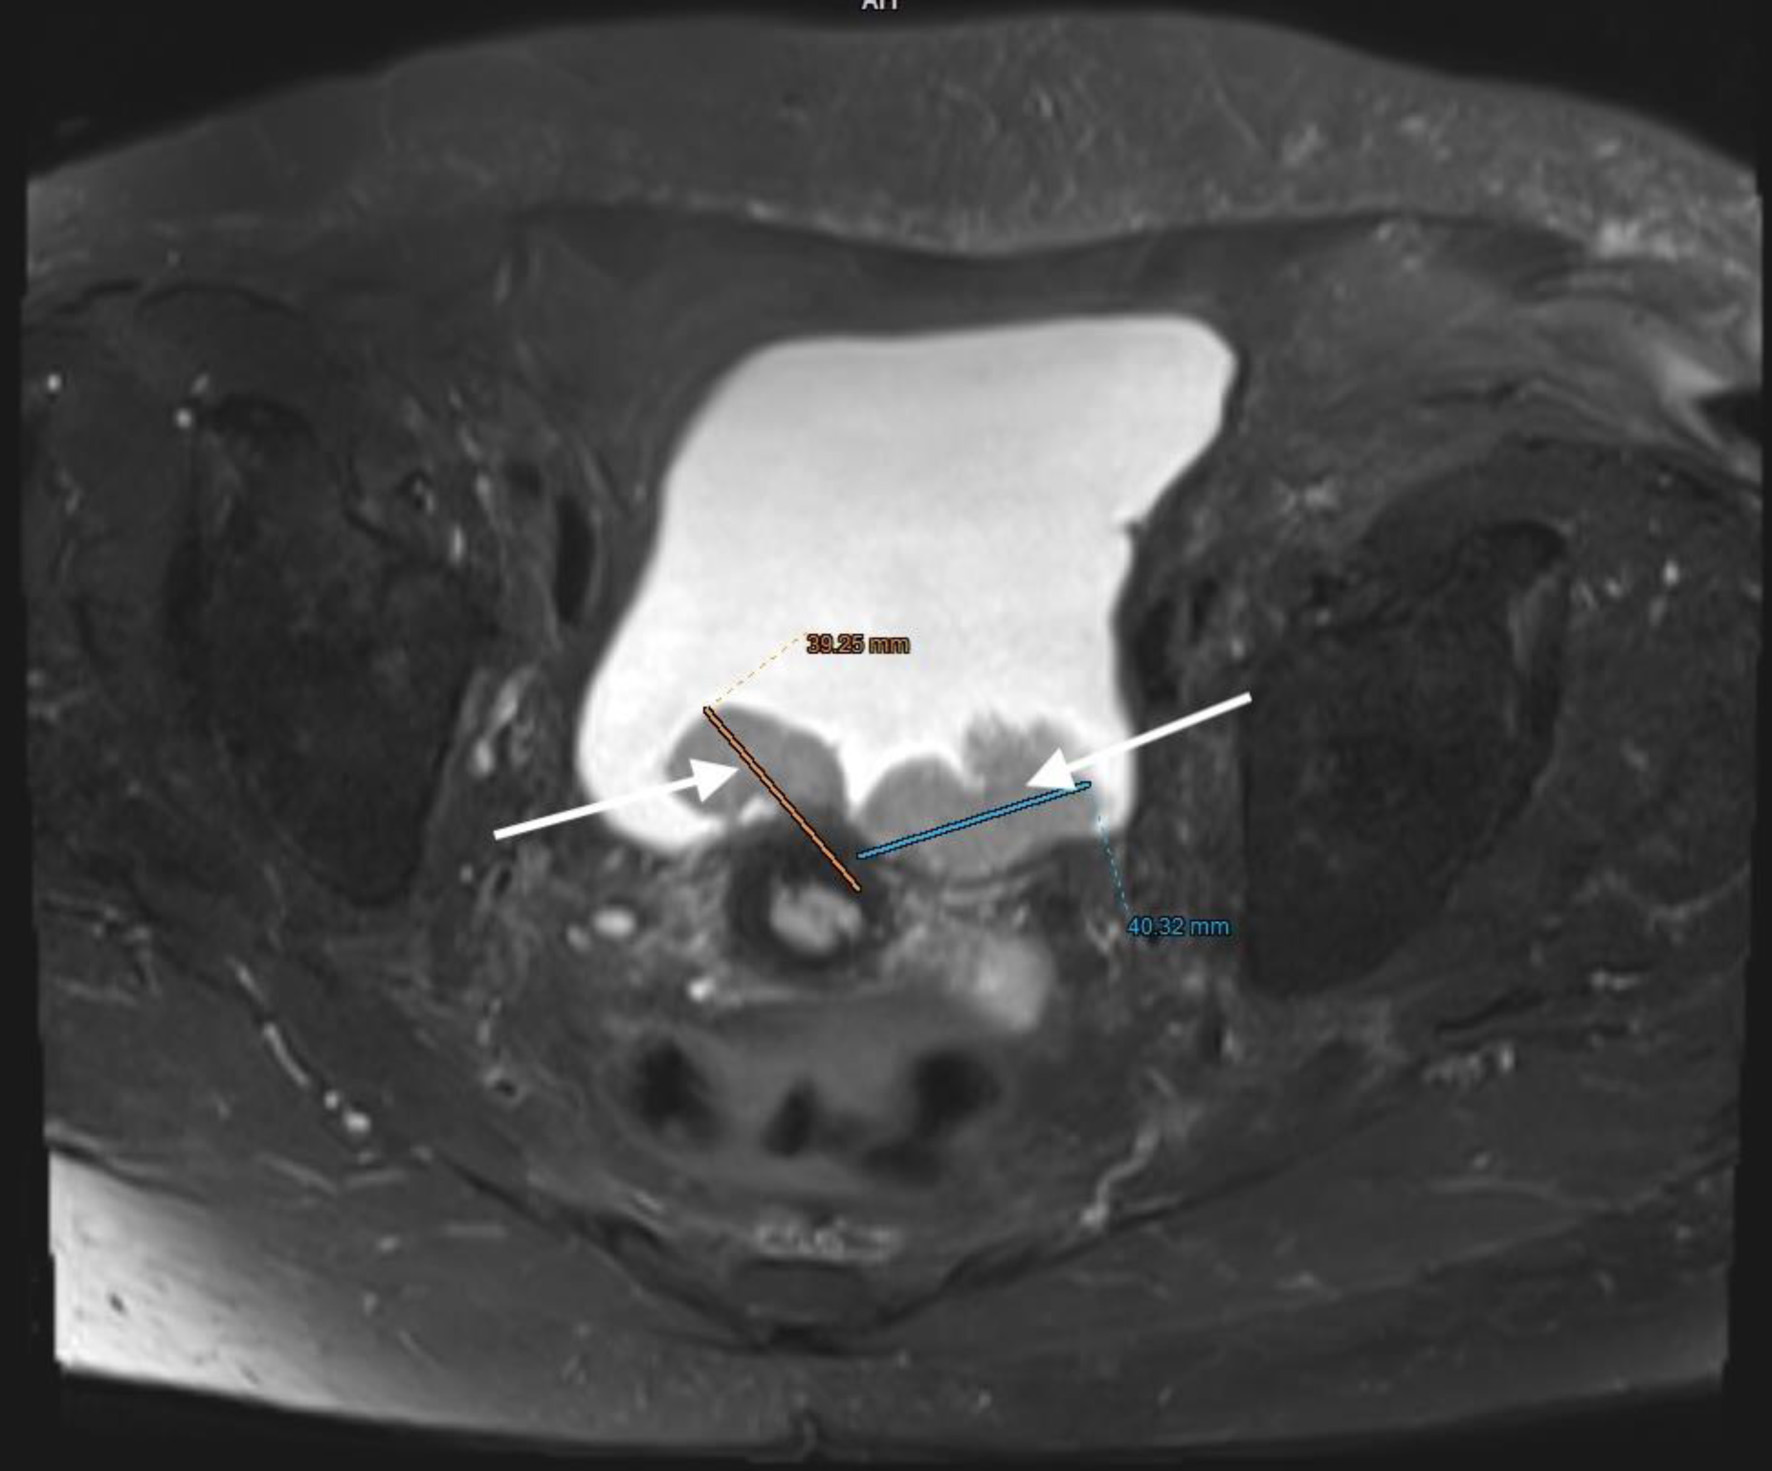
↓ Figure 9. Lower abdominal magnetic resonance imaging (MRI) revealed a vegetative, infiltrative lesion invading the surrounding adipose tissue and occupying the urinary bladder cavity (arrows).
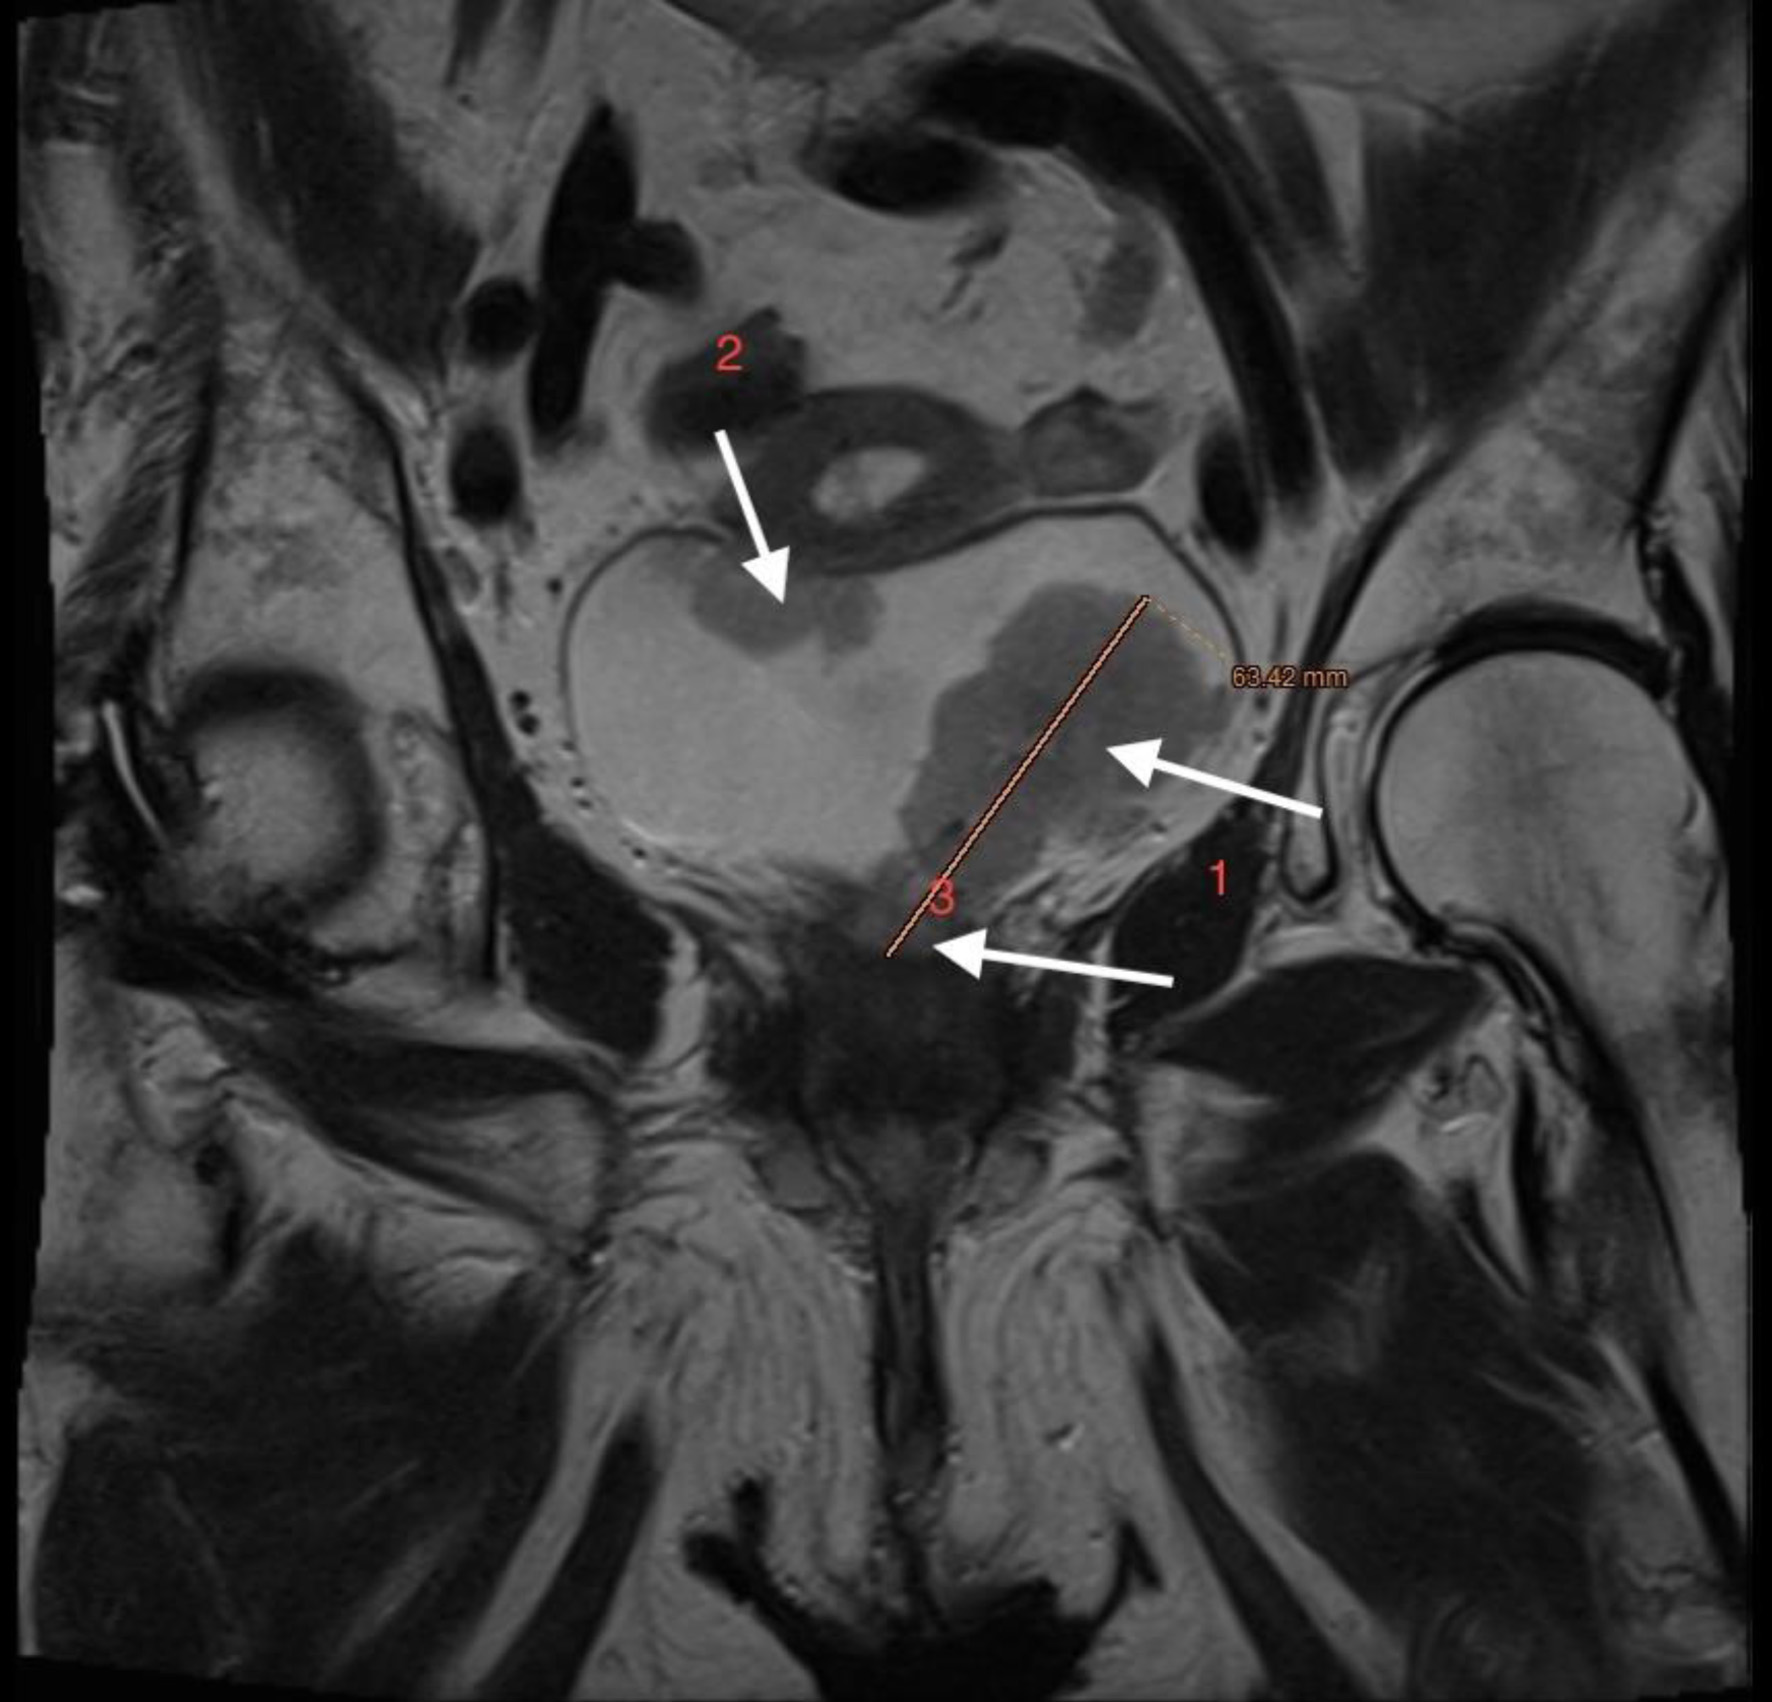
↓ Figure 10. Lower abdominal magnetic resonance imaging (MRI) demonstrated an infiltrative tumor involving the urinary bladder and distal ureter (arrows 1 and 2), with extension into the uterus (arrow 3).
↓ Figure 11. Lower abdominal magnetic resonance imaging (MRI) indicated possible infiltration of uterus (arrow).