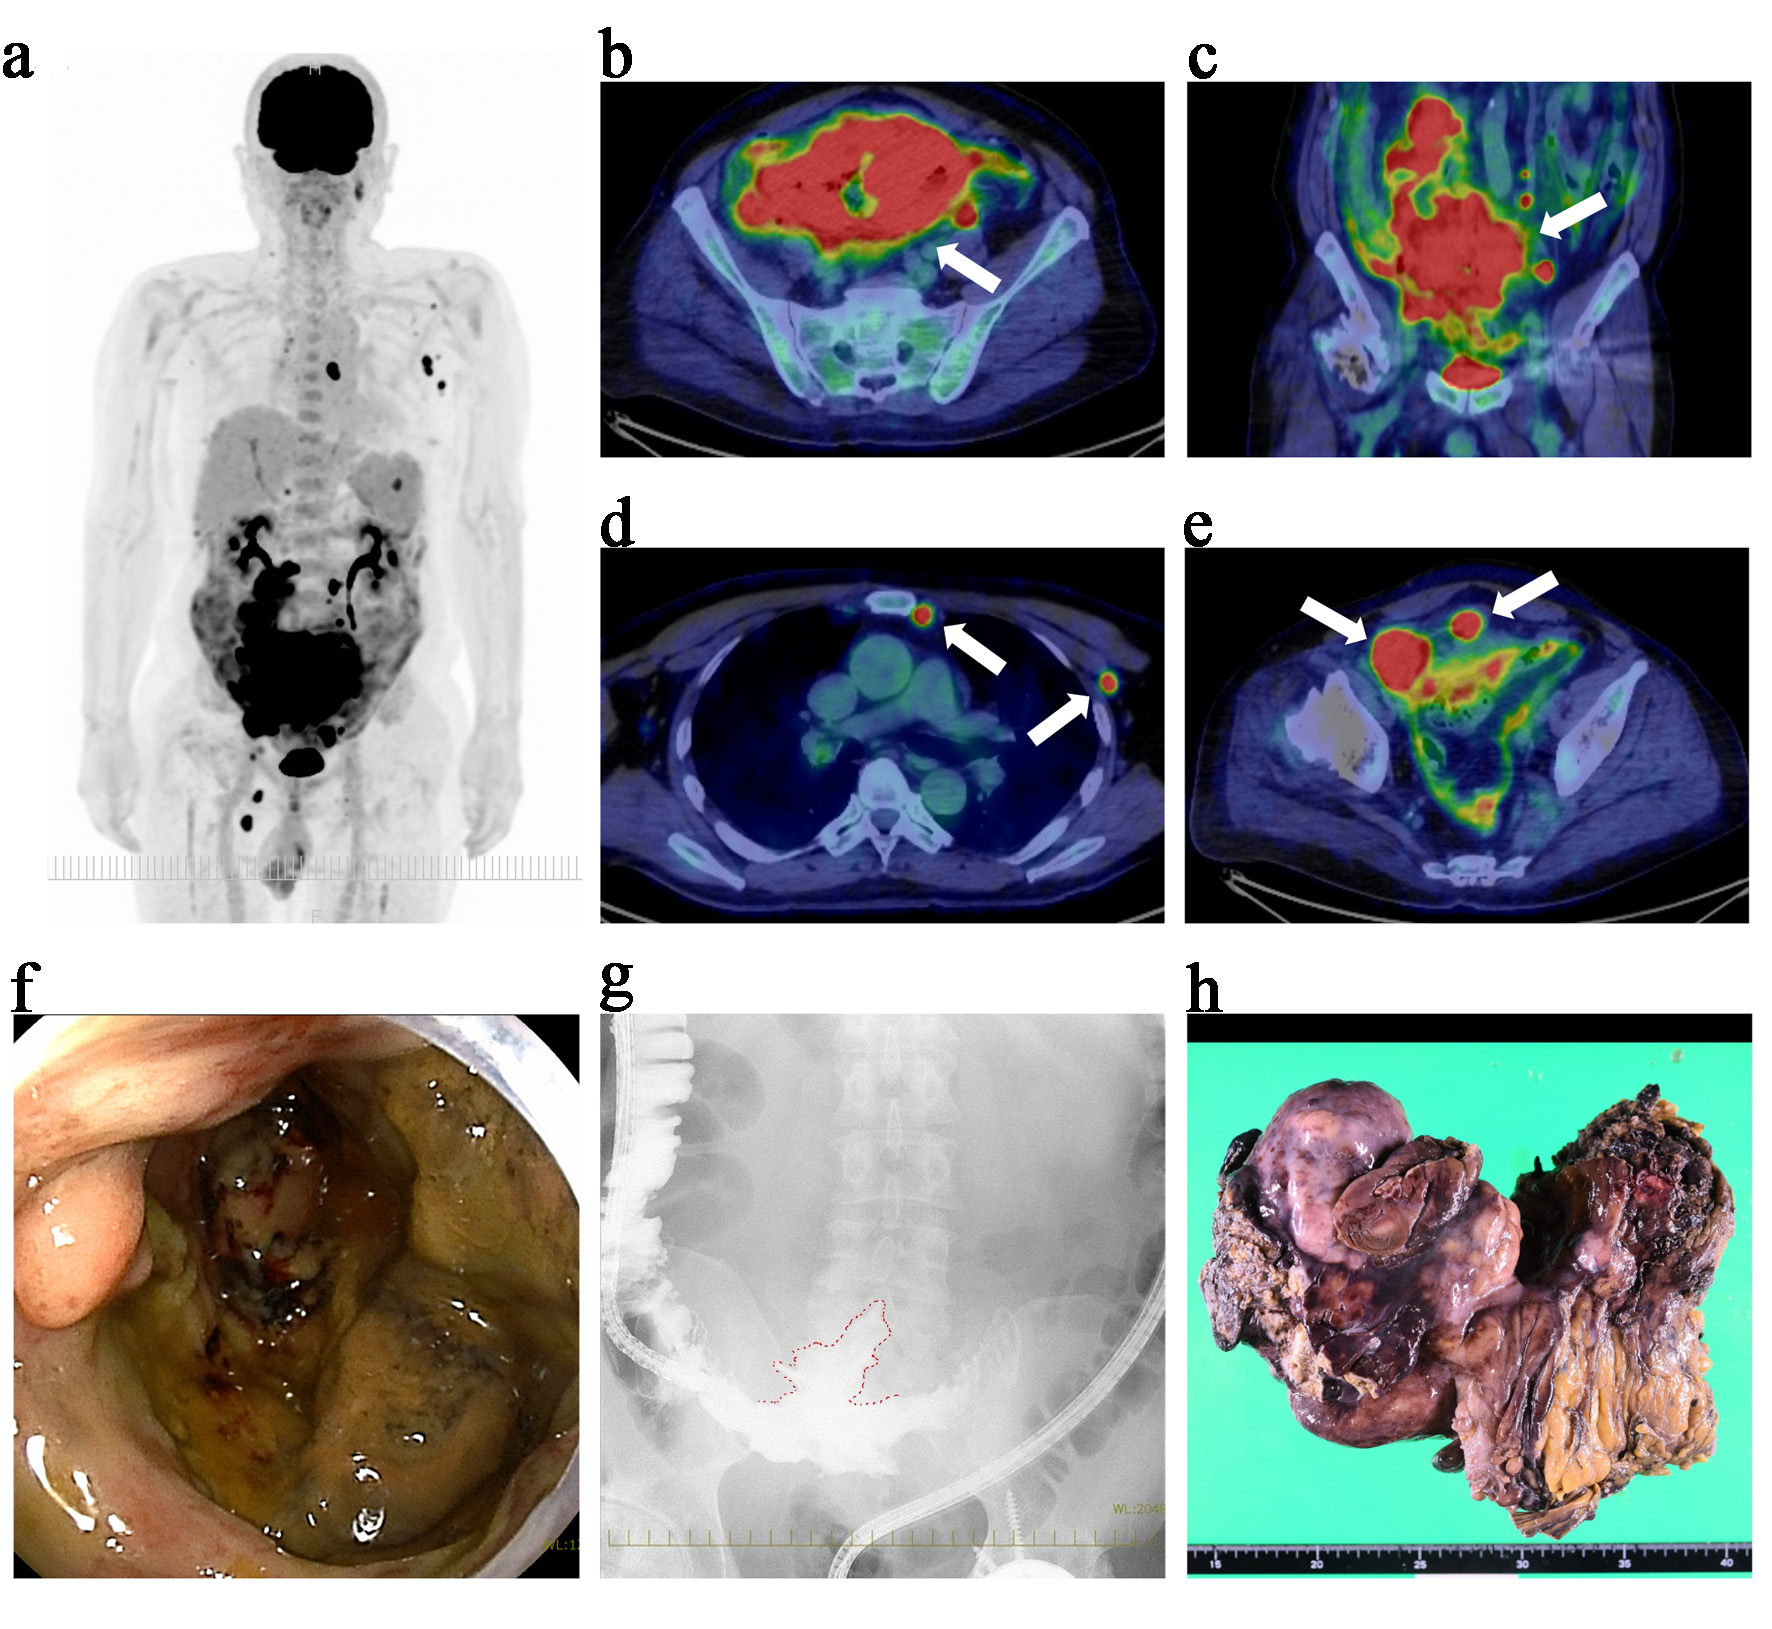
↓ Figure 1. Initial findings prior to
chemotherapy: PET–CT, endoscopy, contrast study, and surgical specimen. (a) Maximum intensity
projection image showing extensive FDG uptake throughout the abdomen and pelvis. (b) Axial PET–CT
view revealing a large hypermetabolic mass in the terminal ileum (white arrow) with a maximum
standardized uptake value (SUVmax) of 27.0. (c) Coronal PET–CT view demonstrating the
same mass, confirming its extensive distribution in the pelvis (white arrow). (d) FDG-avid
lymphadenopathy in the internal thoracic and left axillary regions (white arrows). (e) Axial view
showing FDG uptake in the pelvis, suggestive of peritoneal thickening or mesenteric involvement (white
arrows). (f) Transanal enteroscopy showing an ulcerated mass at the terminal ileum. Biopsy from this
site confirmed the diagnosis of diffuse large B-cell lymphoma, not otherwise specified (DLBCL, NOS). (g)
Contrast enema revealing localized extraluminal leakage of contrast medium (outlined in red), indicative
of a contained perforation into the mesentery. (h) Macroscopic appearance of the resected specimen. The
tumor, measuring approximately 25 cm at its greatest dimension, involved the right hemicolon and a
segment of the terminal ileum, forming a single confluent mass. It was resected en bloc, and
partial necrosis was observed on macroscopic examination. The scale at the bottom of the image is in
centimeters. PET–CT: positron emission tomography–computed tomography; FDG:
fluorodeoxyglucose.