Figures
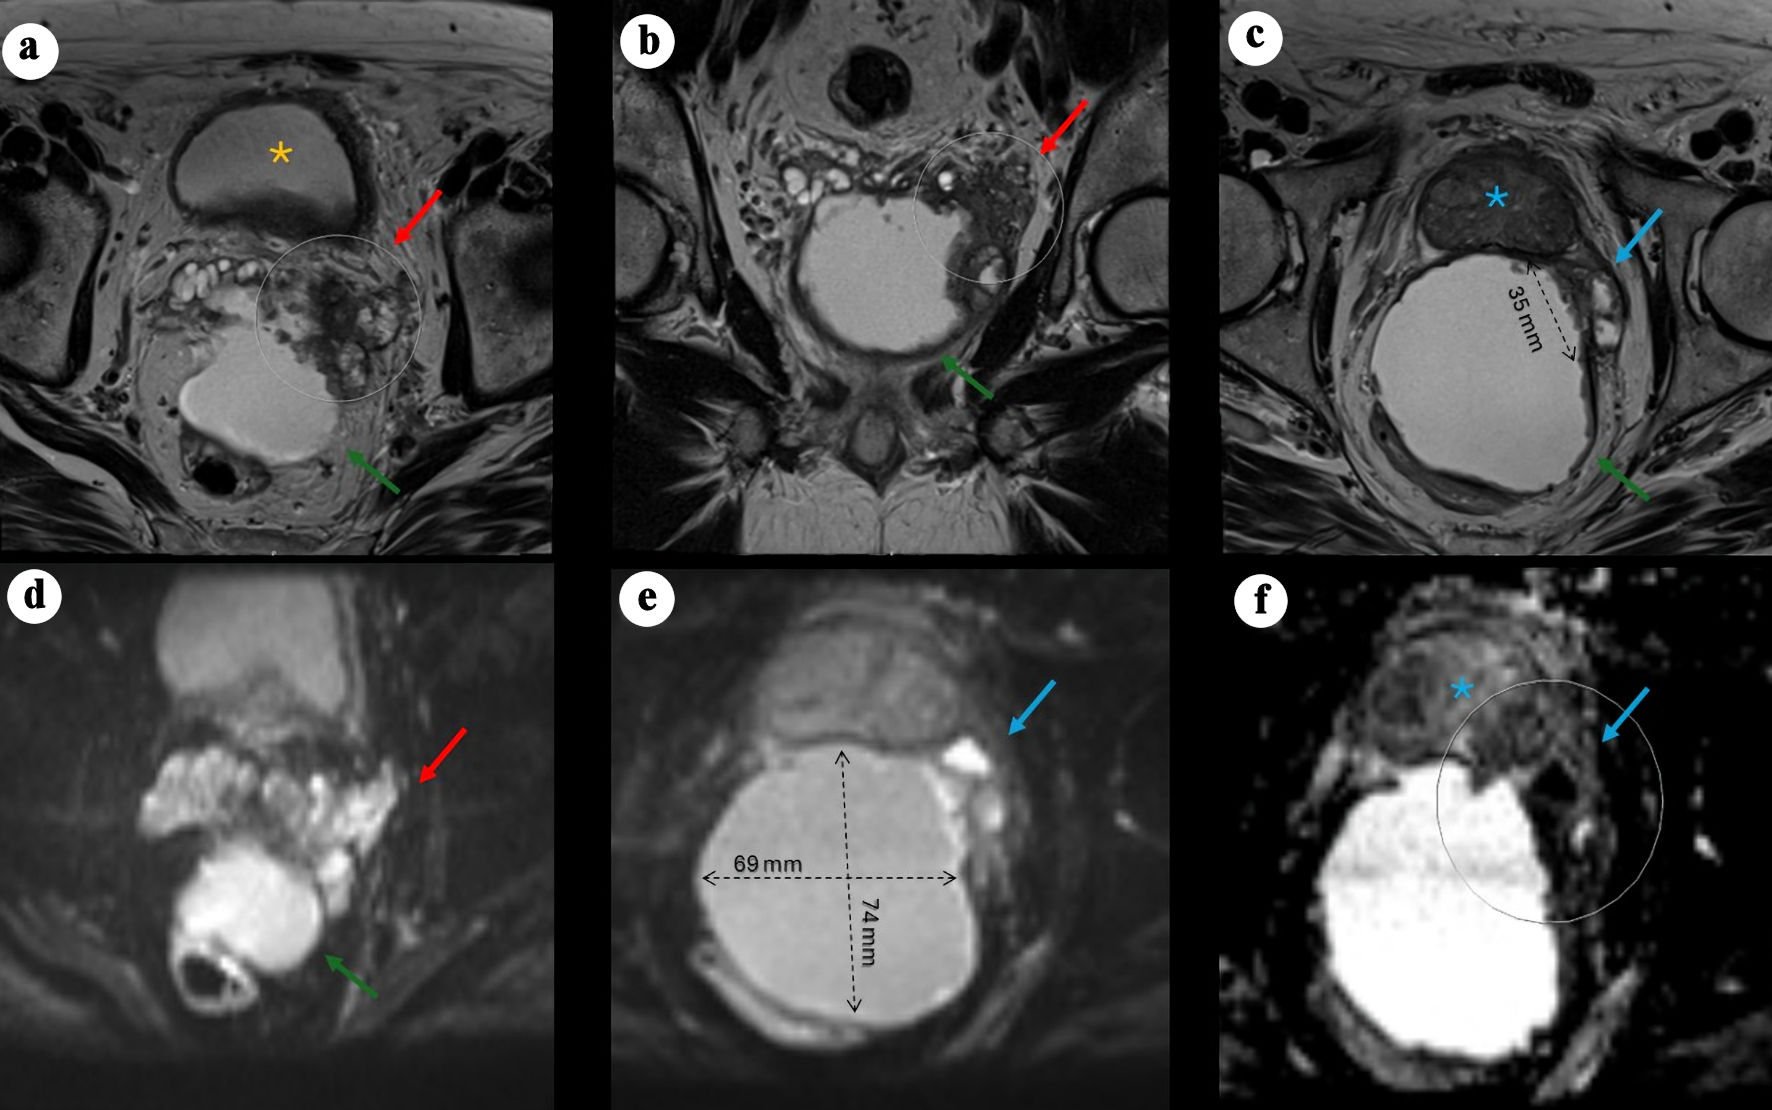
↓ Figure 1. Pelvic MRI demonstrating a large
cystic pelvic mass with features suggestive of malignancy. (a) Axial T2-weighted image showing a large,
predominantly cystic mass (green arrow) situated between the rectum and the posterior left peripheral
zone of the bladder (yellow asterisk), associated with a severely distorted left SV (red arrow)
demonstrating hypoattenuation, suspected to originate from a left SV mass, with rim enhancement and
peripheral nodularity (arrow). (b) Coronal view showing the mass located posteriorly and extending
caudally. (c) Axial view demonstrating an additional smaller cystic focus (3.6 × 1.4 cm) between
the left posterolateral mid-gland and the main lesion. Irregular T2-hypointense tissue extends between
the left inferior SV, the cystic mass, and the left posterolateral base of the prostate, suspicious for
malignancy (PI-RADS 5) with extraprostatic extension. (d) Axial DWI view of the mass. (e) Axial DWI
showing marked diffusion restriction within the prostatic lesion and along the cyst lining (69 × 74
mm process). (f) Axial apparent diffusion coefficient (ADC) map demonstrating corresponding low signal.
MRI: magnetic resonance imaging; PI-RADS: Prostate Imaging–Reporting and Data System; SV: seminal
vesicle; DWI: diffusion-weighted imaging.
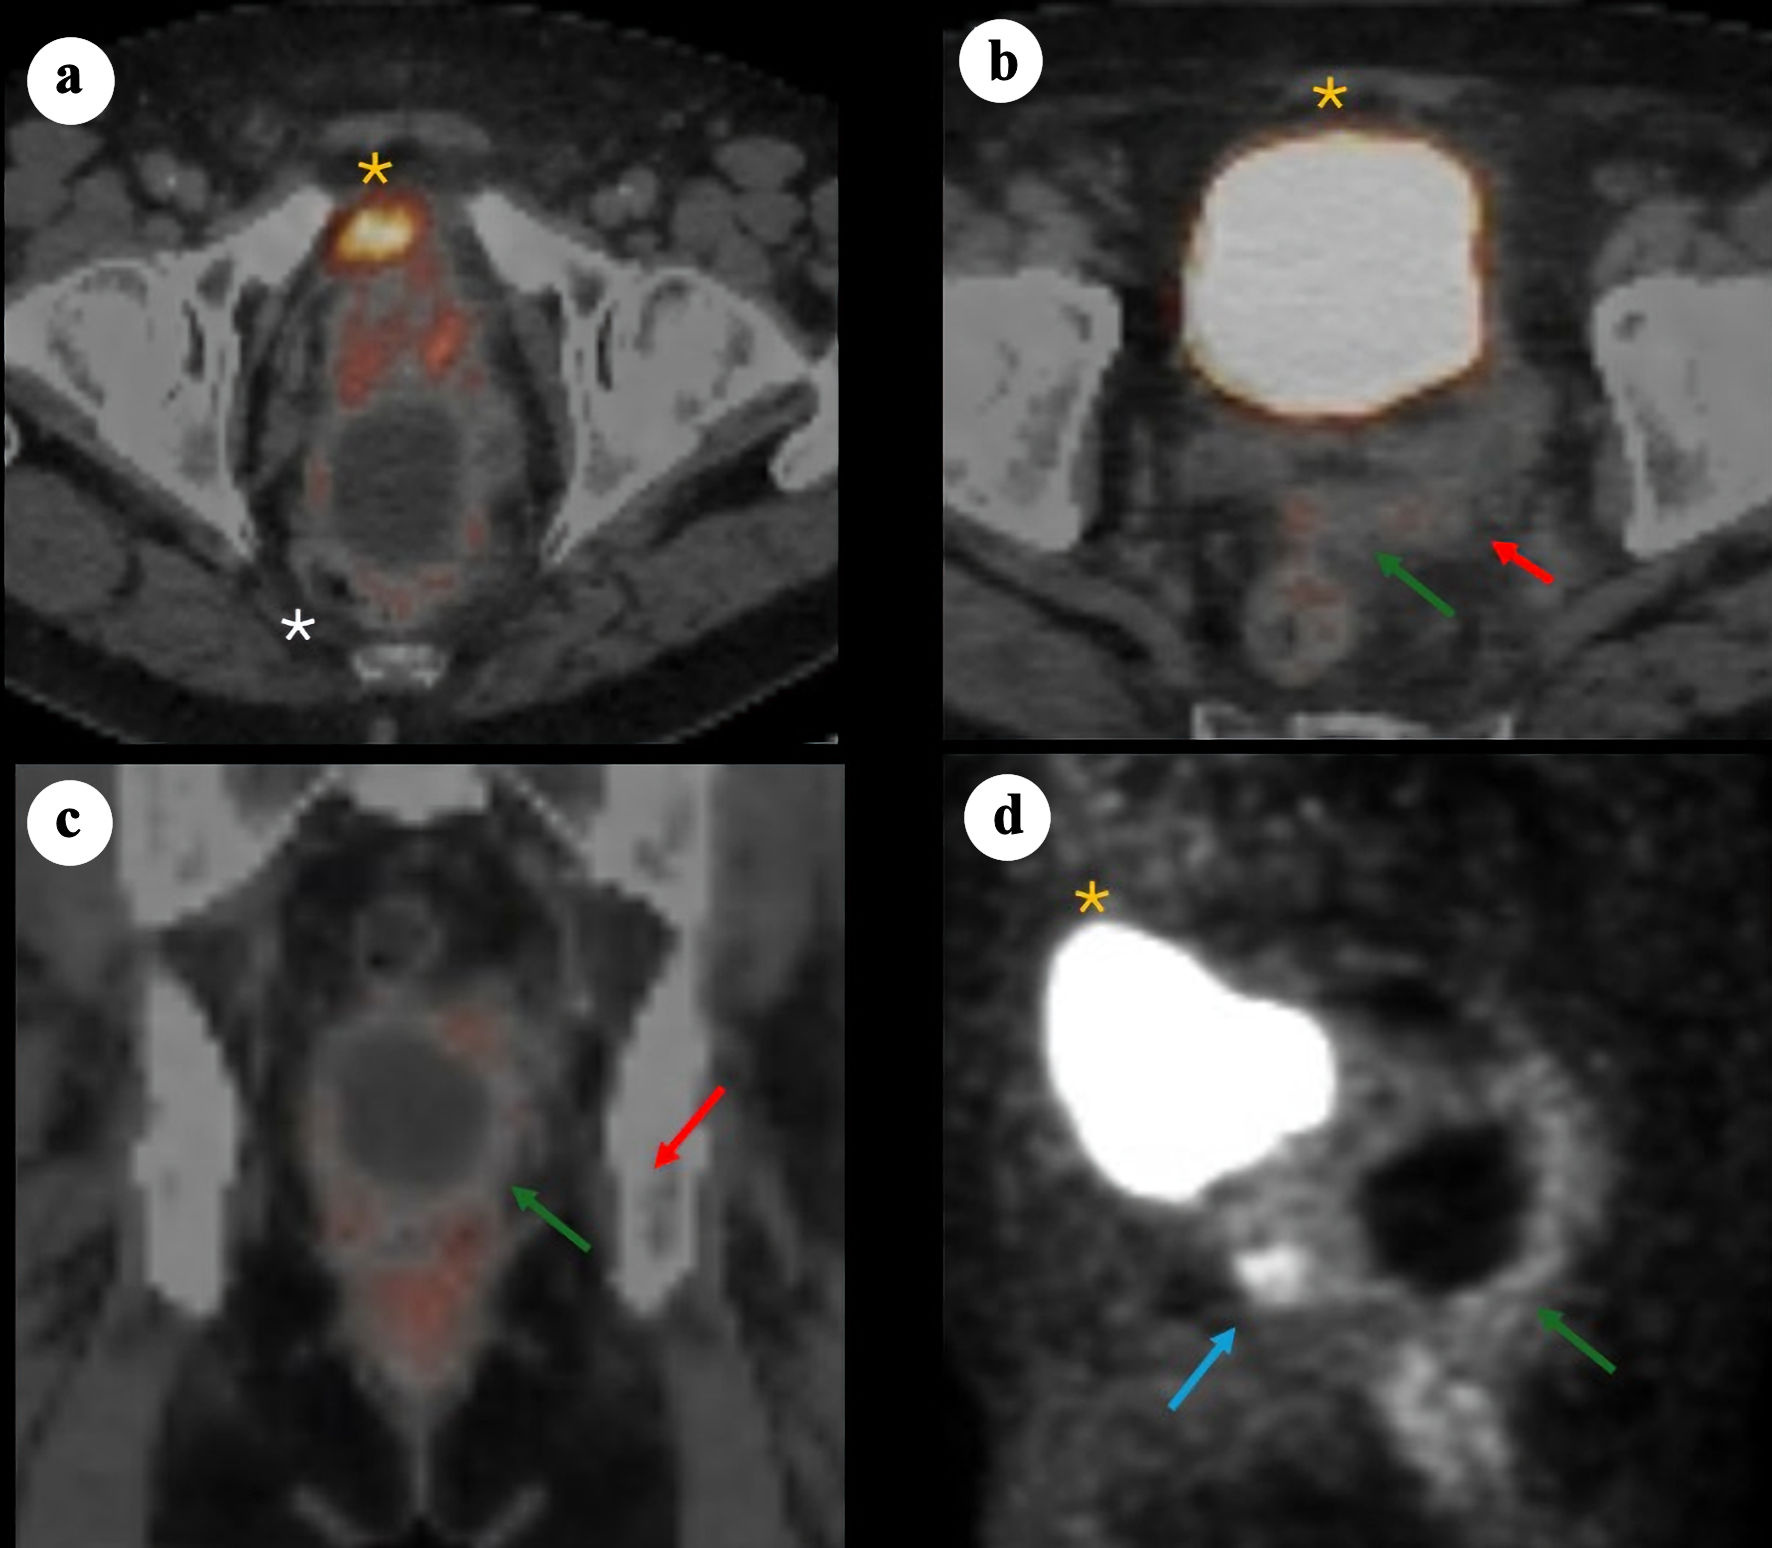
↓ Figure 2. 68Ga-PSMA PET/CT images demonstrating
a large cystic mass in the pelvis consistent with primary SV adenocarcinoma. (a) Axial PET/CT showing
bladder anteriorly (yellow asterisk), prostate (minimal PSMA uptake) and adjacent cystic pelvic mass
(white asterisk). (b) Axial PET/CT showing bladder anteriorly (yellow asterisk), with posterior a solid
component (red arrow) arousing from the left SV and contiguous tissue extension (green arrow). (c)
Coronal fused PET/CT showing the relationship between the cystic mass and the adjacent prostate/SV
region, with the solid enhancing component (red arrow) and soft tissue extension (green arrow). (d)
Sagittal PET maximum intensity projection illustrating the prostate solid lesion component (blue arrow)
and cyst (green arrow) posterior and caudal to the bladder (yellow asterisk). PSMA: prostate-specific
membrane antigen; PET/CT: positron emission tomography/computed tomography; SV: seminal vesicle.
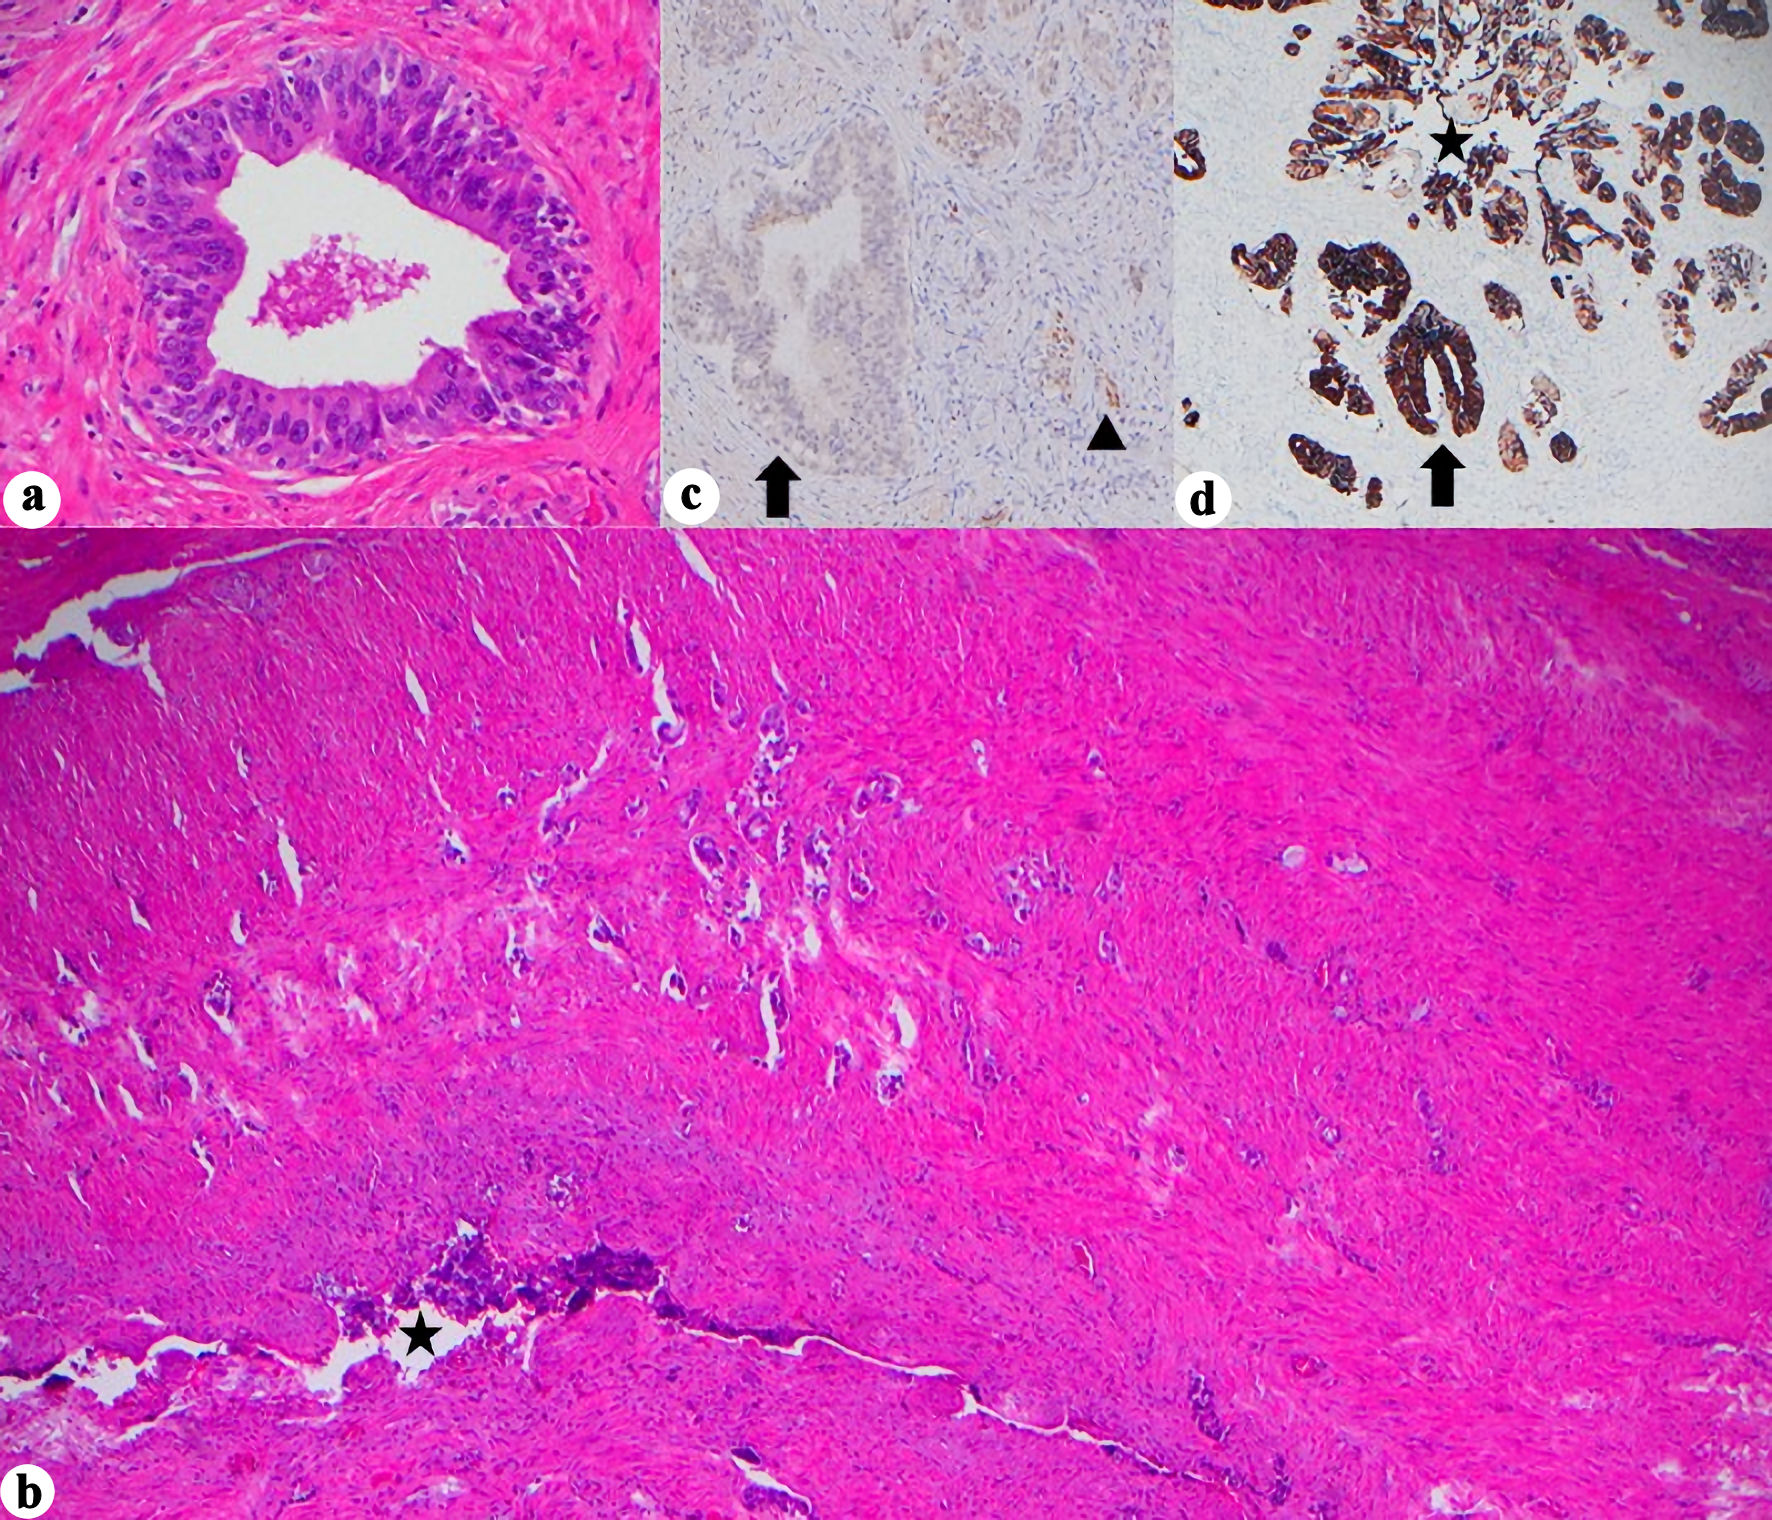
↓ Figure 3. Histopathologic and
immunohistochemical features of seminal vesicle involvement. (a) Marked cellular atypia arising in
continuity with SV lumen, assumed to be in situ component, (H&E, × 400). (b) Glandular
infiltration into SV wall (H&E, × 40, star = SV lumen). (c) PAX8 negativity in the in
situ component but retained in normal SV epithelium (× 400, arrow = in situ glands,
arrowhead = normal SV). (d) CK7 positivity in the in situ component and normal SV glands (×
40, star = SV lumen, arrow = in situ glands). H&E: hematoxylin and eosin stain; SV: seminal
vesicle; CK: cytokeratin; PAX8: paired box gene 8.
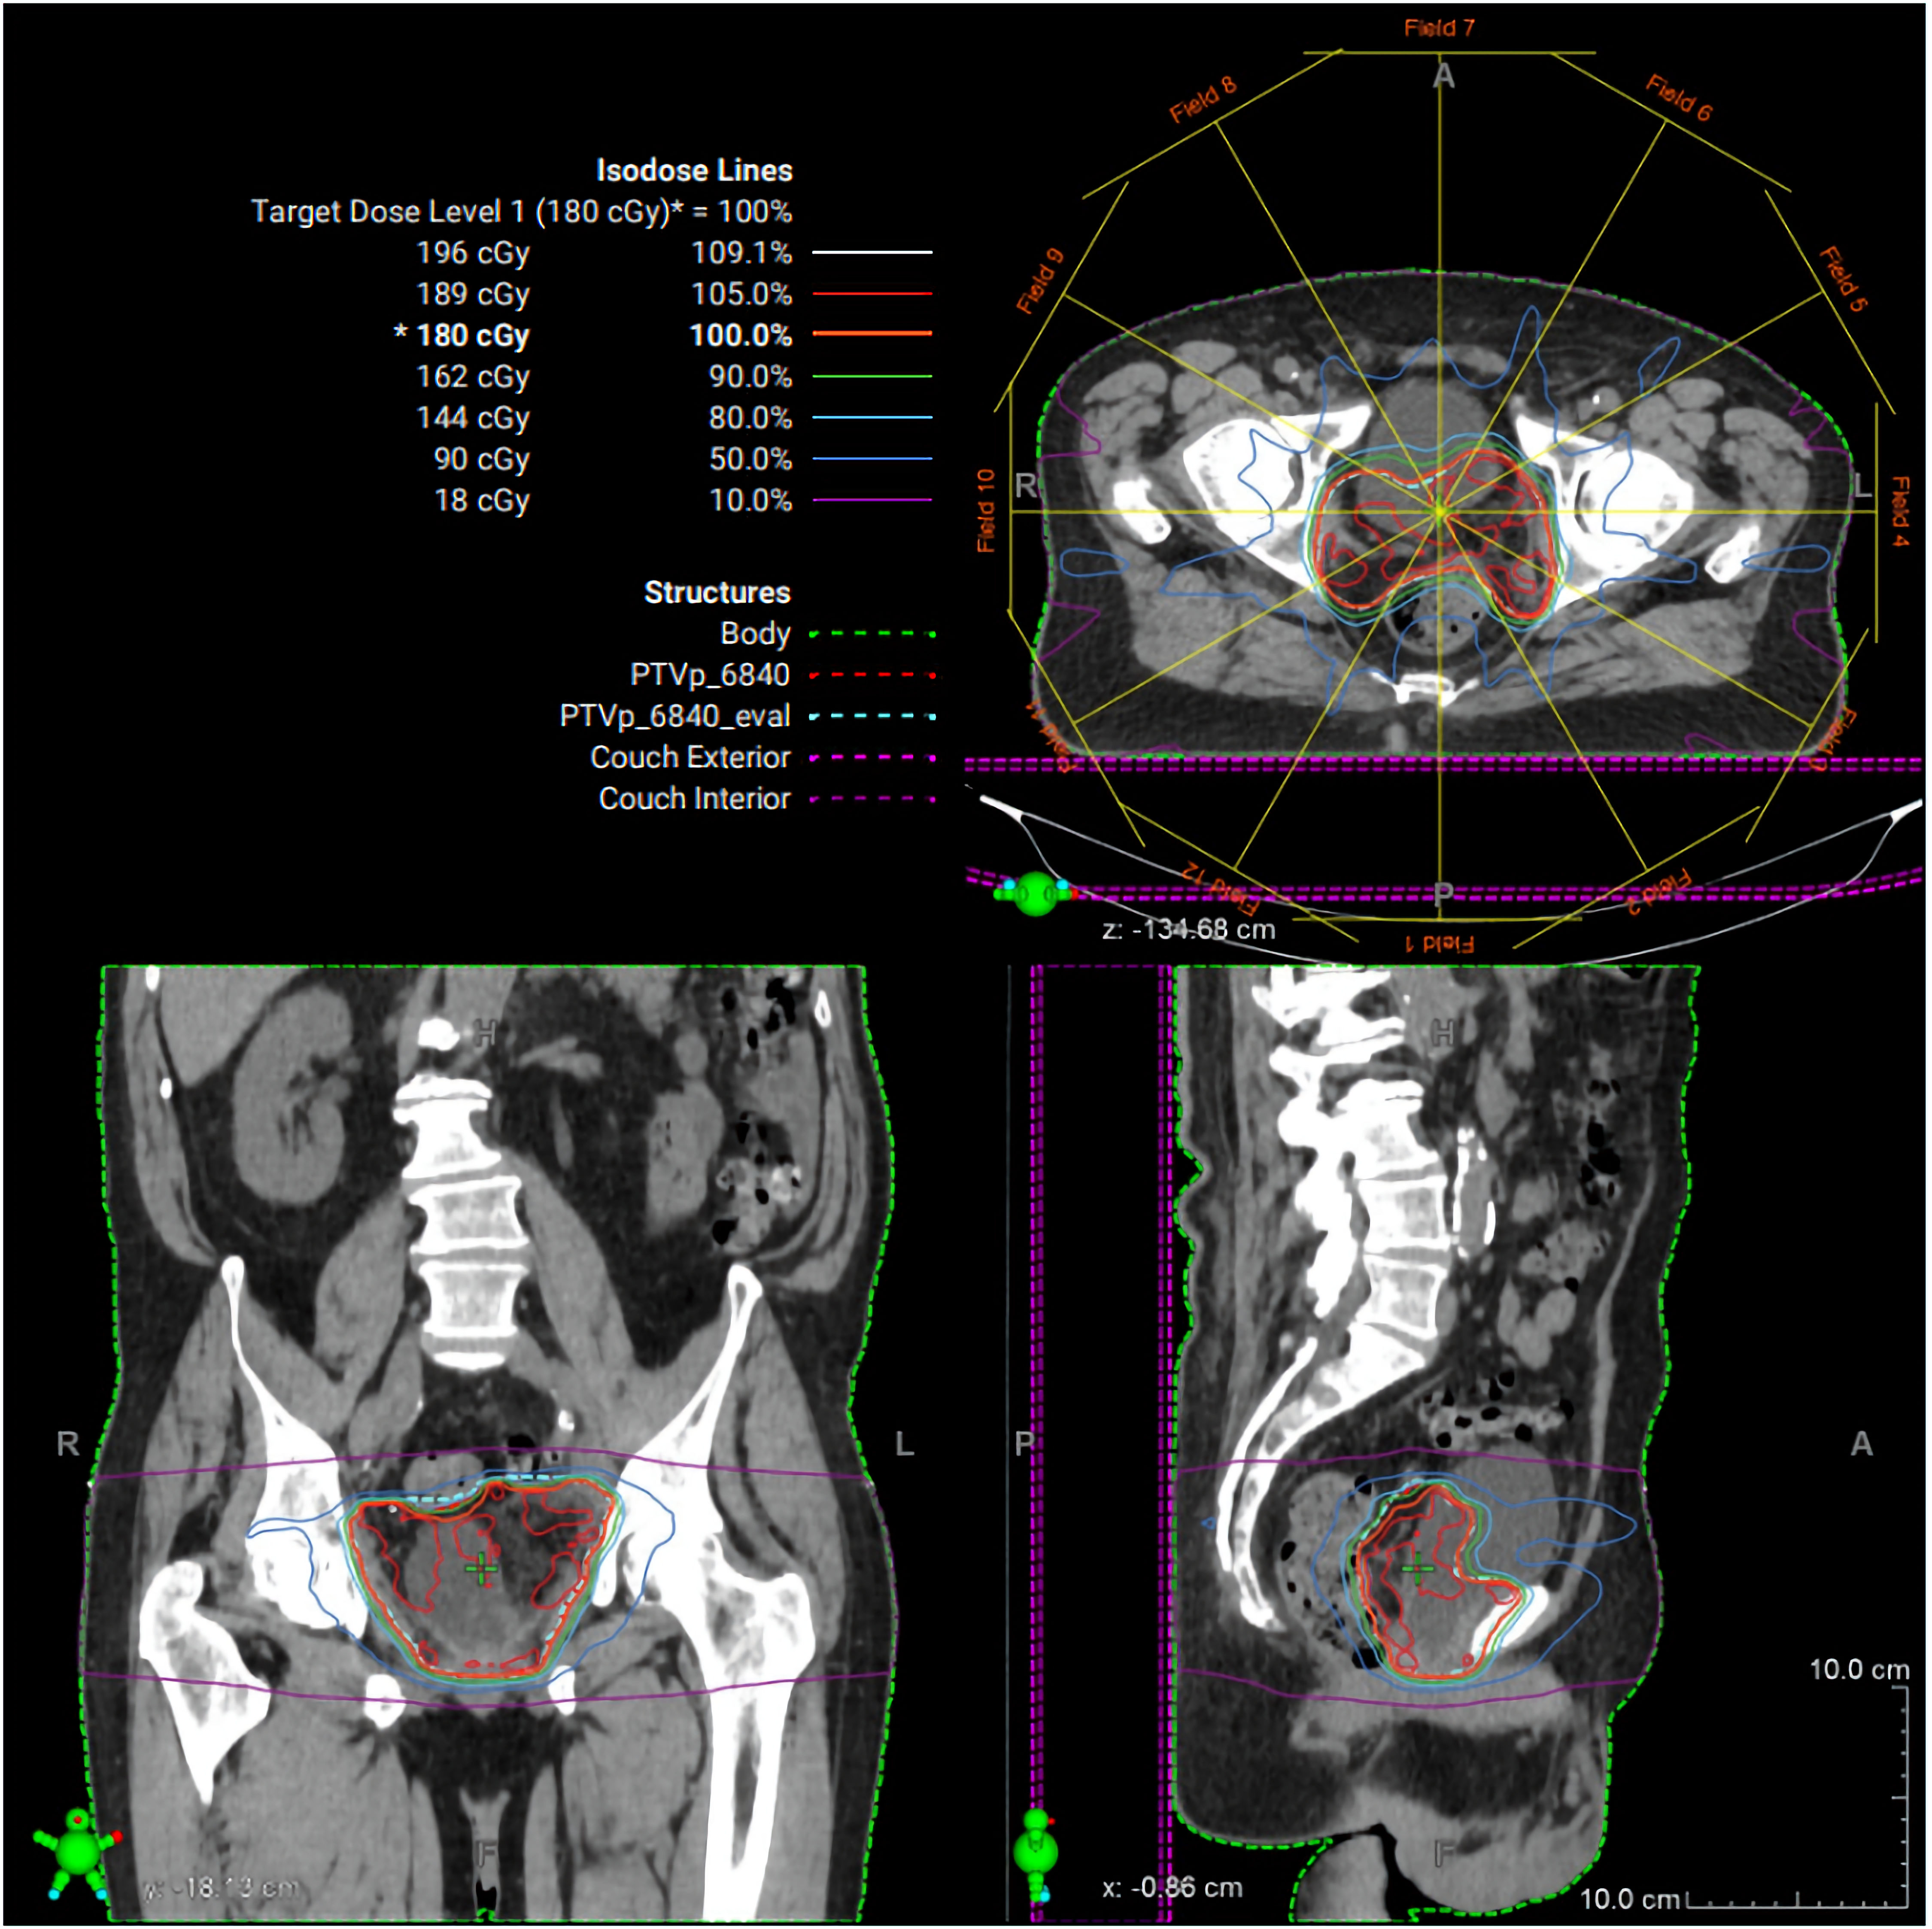
↓ Figure 4. Radiation therapy treatment plan.
Representative intensity-modulated radiation therapy (IMRT) plan demonstrating axial, coronal, and
sagittal dose distributions for the pelvic target volume. Isodose lines represent percentage dose levels
relative to the prescribed 180 cGy fraction. The planning target volume is shown in green, with
color-coded isodose curves illustrating conformal coverage of the target and sparing of surrounding
normal tissues.
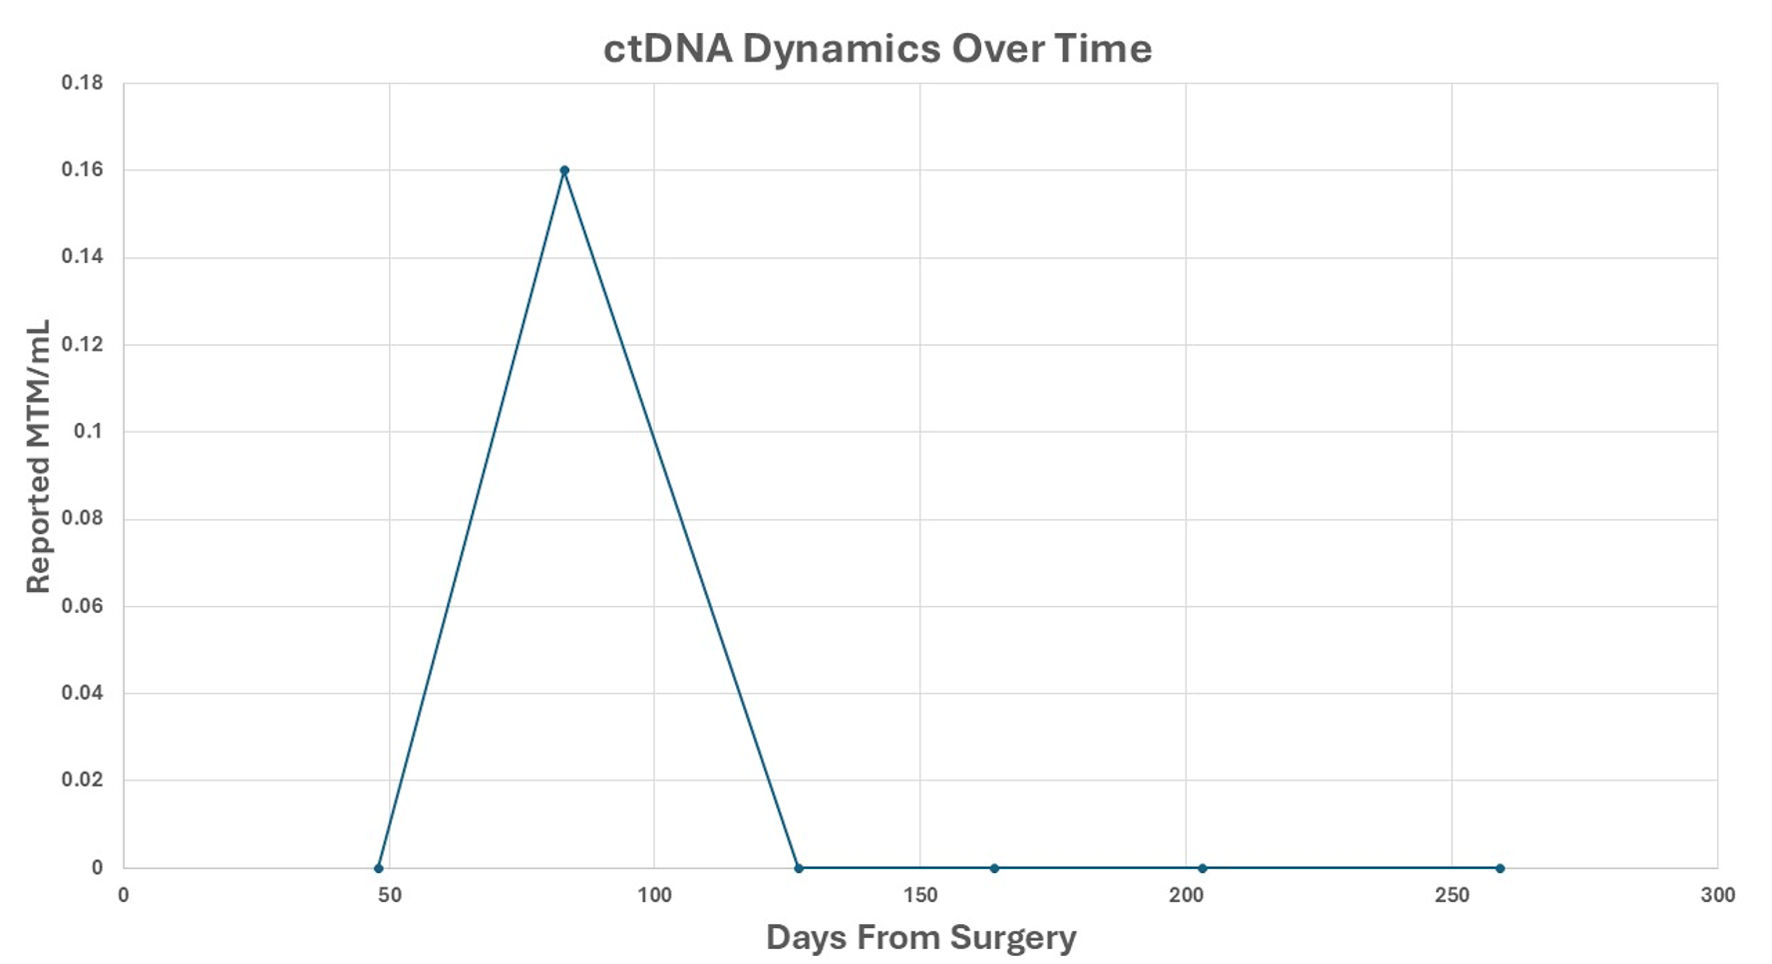
↓ Figure 5. ctDNA dynamics over time. Reported
ctDNA levels were measured as MTM/mL, following surgical resection. Each point represents a
postoperative plasma sample collected at the indicated time (days from surgery). A transient ctDNA peak
was observed at approximately 70 days, followed by sustained clearance thereafter. ctDNA: circulating
tumor DNA; MTM/mL: mean tumor molecules per milliliter.