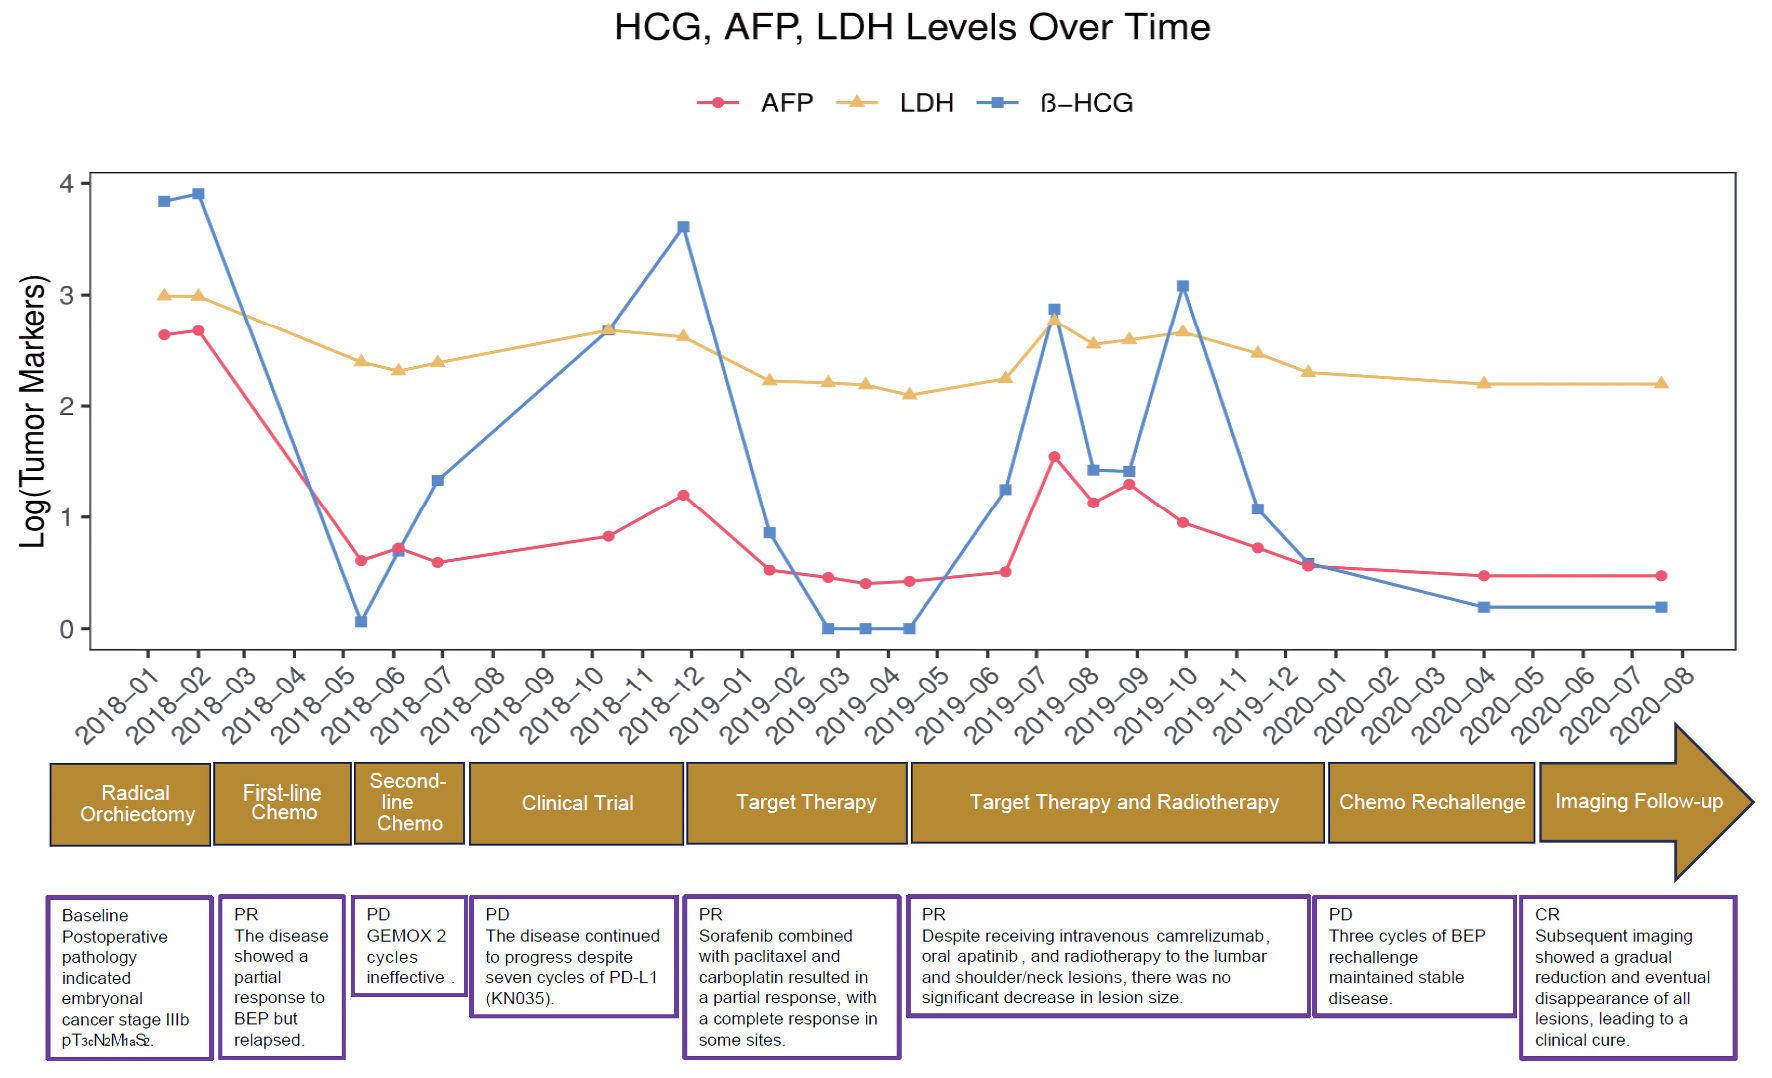
↓ Figure 1. Tumor marker levels (hCG, AFP, LDH)
and patient treatment timeline. The graph illustrates the patient’s tumor marker levels over
time, corresponding to various stages of treatment and clinical response. The timeline at the bottom
details the specific therapies administered, including orchiectomy, several chemotherapy regimens,
targeted therapy, and radiotherapy. The markers track the patient’s condition from initial
partial response and relapse to a final clinical cure. hCG: human chorionic gonadotropin; AFP:
alpha-fetoprotein; LDH: lactate dehydrogenase; BEP: bleomycin + etoposide + cisplatin; GEMOX:
gemcitabine plus oxaliplatin; PD: progressive disease; PD-L1: programmed cell death ligand 1; PR:
partial response; CR: complete response.
↓ Figure 2. Imaging changes throughout the entire
treatment and follow-up process. (a) CT-guided biopsy in 2018 and 2019. (b, c) Imaging changes in the
retroperitoneum, lumbar vertebral bodies and bilateral lungs throughout the entire treatment and
follow-up process. The oval circles marked the metastatic lesions in the retroperitoneal lymph nodes and
lumbar vertebral bodies, and the arrows indicated the bilateral lung lesions. Treatment and follow-up
time points were shown on the left. (d) Changes shown on brain MRI of metastatic lesions in the left
frontal lobe (arrow) throughout the entire treatment and follow-up process. The treatment and follow-up
time points were shown below. CT: computed tomography; MRI: magnetic resonance imaging; PD-L1:
programmed death-ligand 1; BEP: bleomycin + etoposide + cisplatin.