Journal of Medical Cases, ISSN 1923-4155 print, 1923-4163 online, Open Access
Article copyright, the authors; Journal compilation copyright, J Med Cases and Elmer Press Inc
Journal website https://jmc.elmerpub.com

Case Report

Volume 16, Number 8, August 2025, pages 300-308


Extended-Hours Hemodialysis Without Dietary Restrictions Reduces Risk of Vascular Calcification

Figures

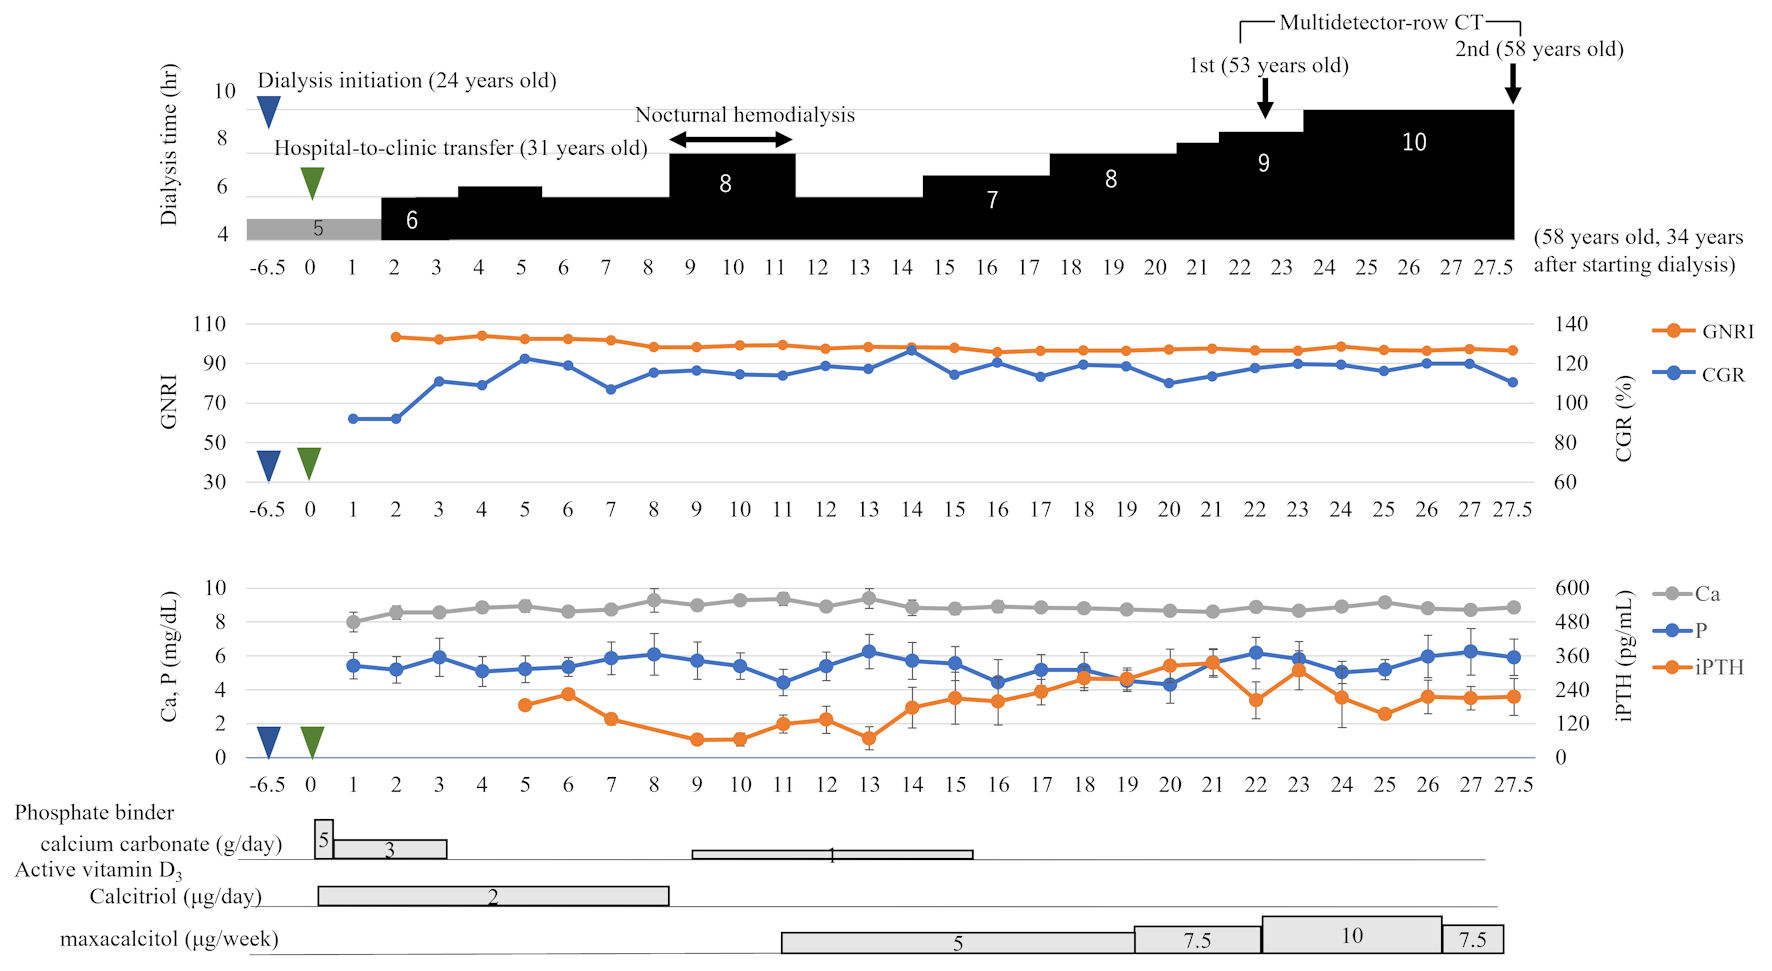
↓  Figure 1. Clinical course over 27.5 years (31 - 58 years old) after the transfer. The patient began 6-h extended-hours hemodialysis without dietary restrictions 1.5 years after the transfer. The dialysis time was gradually extended to 10 h, and extended-hours hemodialysis without dietary restrictions has been maintained for 26 years. The GNRI levels, a nutritional index, remained in the normal range. The CGR, a muscle mass index, increased after the change in dialysis time to 6 h, reaching 109% after 3 years. Calcium remained slightly low, phosphorus was almost in the normal range, and the phosphate binder calcium carbonate was discontinued after 16 years. After 17 years, the iPTH levels showed an upward trend, while the active vitamin D3 dosage increased. The blue arrow indicates the dialysis initiation, and the green arrow indicates general hospital-to-clinic transfer. GNRI: geriatric nutritional risk index; CGR: creatinine generation rate; Ca: calcium; P: phosphate; iPTH: intact parathyroid hormone; CT: computed tomography.
Figure 1.
↓  Figure 2. The first abdominal CT scan 29 years after the initiation of dialysis (age 53). (a) Coronal section. (b, c) Axial sections showing abdominal aortic calcification area. The red arrow indicates the upper calcification area, and the blue arrow indicates the lower area. Despite undergoing 29 years of long-term dialysis, calcification remained slight. CT: computed tomography.
Figure 2.
↓  Figure 3. The second abdominal CT scan taken 34 years after initiating dialysis (5 years after the first CT scan). (a) Coronal section. (b, c) Axial sections showing abdominal aortic calcification area. The red arrow indicates the upper calcification area, and the blue arrow indicates the lower area. There has been little change in the calcified lesions after 5 years. CT: computed tomography.
Figure 3.
↓  Figure 4. Three-dimensional computed tomography (3DCT) of the abdominal aorta to arteria femoralis. Calcification was observed only in the internal iliac artery but not in the external iliac artery to the femoral artery (white arrows).
Figure 4.

Tables

↓  Table 1. Average Laboratory Data Over 27.5 Years After Transfer (December 1998 - May 2024)
 
Laboratory value Results N Reference range
Data are expressed as mean ± standard deviation. UN: urea nitrogen; β2MG: β2-microglobulin; LDL-cholesterol: low-density lipoprotein cholesterol; HDL-cholesterol: high-density lipoprotein cholesterol; iPTH: intact parathyroid hormone.
White blood cell (/µL) 6,384.3 ± 398.5 559 4,000 - 8,000
Red blood cell (× 104/µL) 347.6 ± 30.1 559 330 - 390
Hemoglobin (g/dL) 11.0 ± 1.0 559 10.0 - 12.0
Total protein (g/dL) 6.5 ± 0.3 103 6.5 - 8.3
Albumin (g/dL) 4.0 ± 0.4 321 3.5 - 5.0
UN (mg/dL) 69.2 ± 7.4 82
Creatinine (mg/dL) 13.2 ± 1.2 82 12.0 - 14.0
β2MG (mg/L) 29.7 ± 3.2 96 < 30
Triglyceride (mg/dL) 145.2 ± 49.2 76 30 - 149
Total cholesterol (mg/dL) 190.9 ± 19.5 76 < 180
LDL-cholesterol (mg/dL) 120.4 ± 16.4 76 < 120
HDL-cholesterol (mg/dL) 43.9 ± 7.0 76 > 40
Sodium (mEq/L) 142.0 ± 1.2 290 136 - 147
Potassium (mEq/L) 4.8 ± 0.3 563 3.6 - 5.0
Calcium (mg/dL) 8.8 ± 0.3 511 8.4 - 10.0
Phosphate (mg/dL) 5.4 ± 0.5 512 3.5 - 6.0
iPTH (pg/mL) 197.8 ± 76.2 195 60 - 240
Alkaline phosphatase (U/L) 190.5 ± 63.9 381 104 - 338
Ferritin (ng/mL) 59.0 ± 45.7 76 100 - 300


↓  Table 2. Average Hemodialysis Procedure Data Over 27.5 Years After Transfer
 
Procedure data
spKt/V: single-pool urea fractional clearance; TAC-urea: time-average concentration of urea; nPCR: normalized protein catabolic rate; CGR: percentage creatinine generation rate; GNRI: geriatric nutritional risk index; PS: polysulfone; PES: polyethersulfone; CTA: cellulose triacetate; PMMA: polymethyl methacrylate.
Blood flow rate (mL/min) 178.8 ± 9.7
Dialysate flow rate (mL/min) 300
Dialysate composition (mEq/L) Na+ = 140, K+ = 2.0, Ca++ = 3.0
Dialysis membrane PS, PES, CTA and/or PMMA
Membrane area (m2) 1.3 - 2.5
spKt/V 1.97 ± 0.32
TAC-urea (mg/dL) 41.2 ± 7.2
Ca-P product 47.9 ± 5.1
nPCR (g/kg/day) 1.02 ± 0.12
CGR (%) 114.3 ± 9.9
GNRI 99.2 ± 4.0