Figures
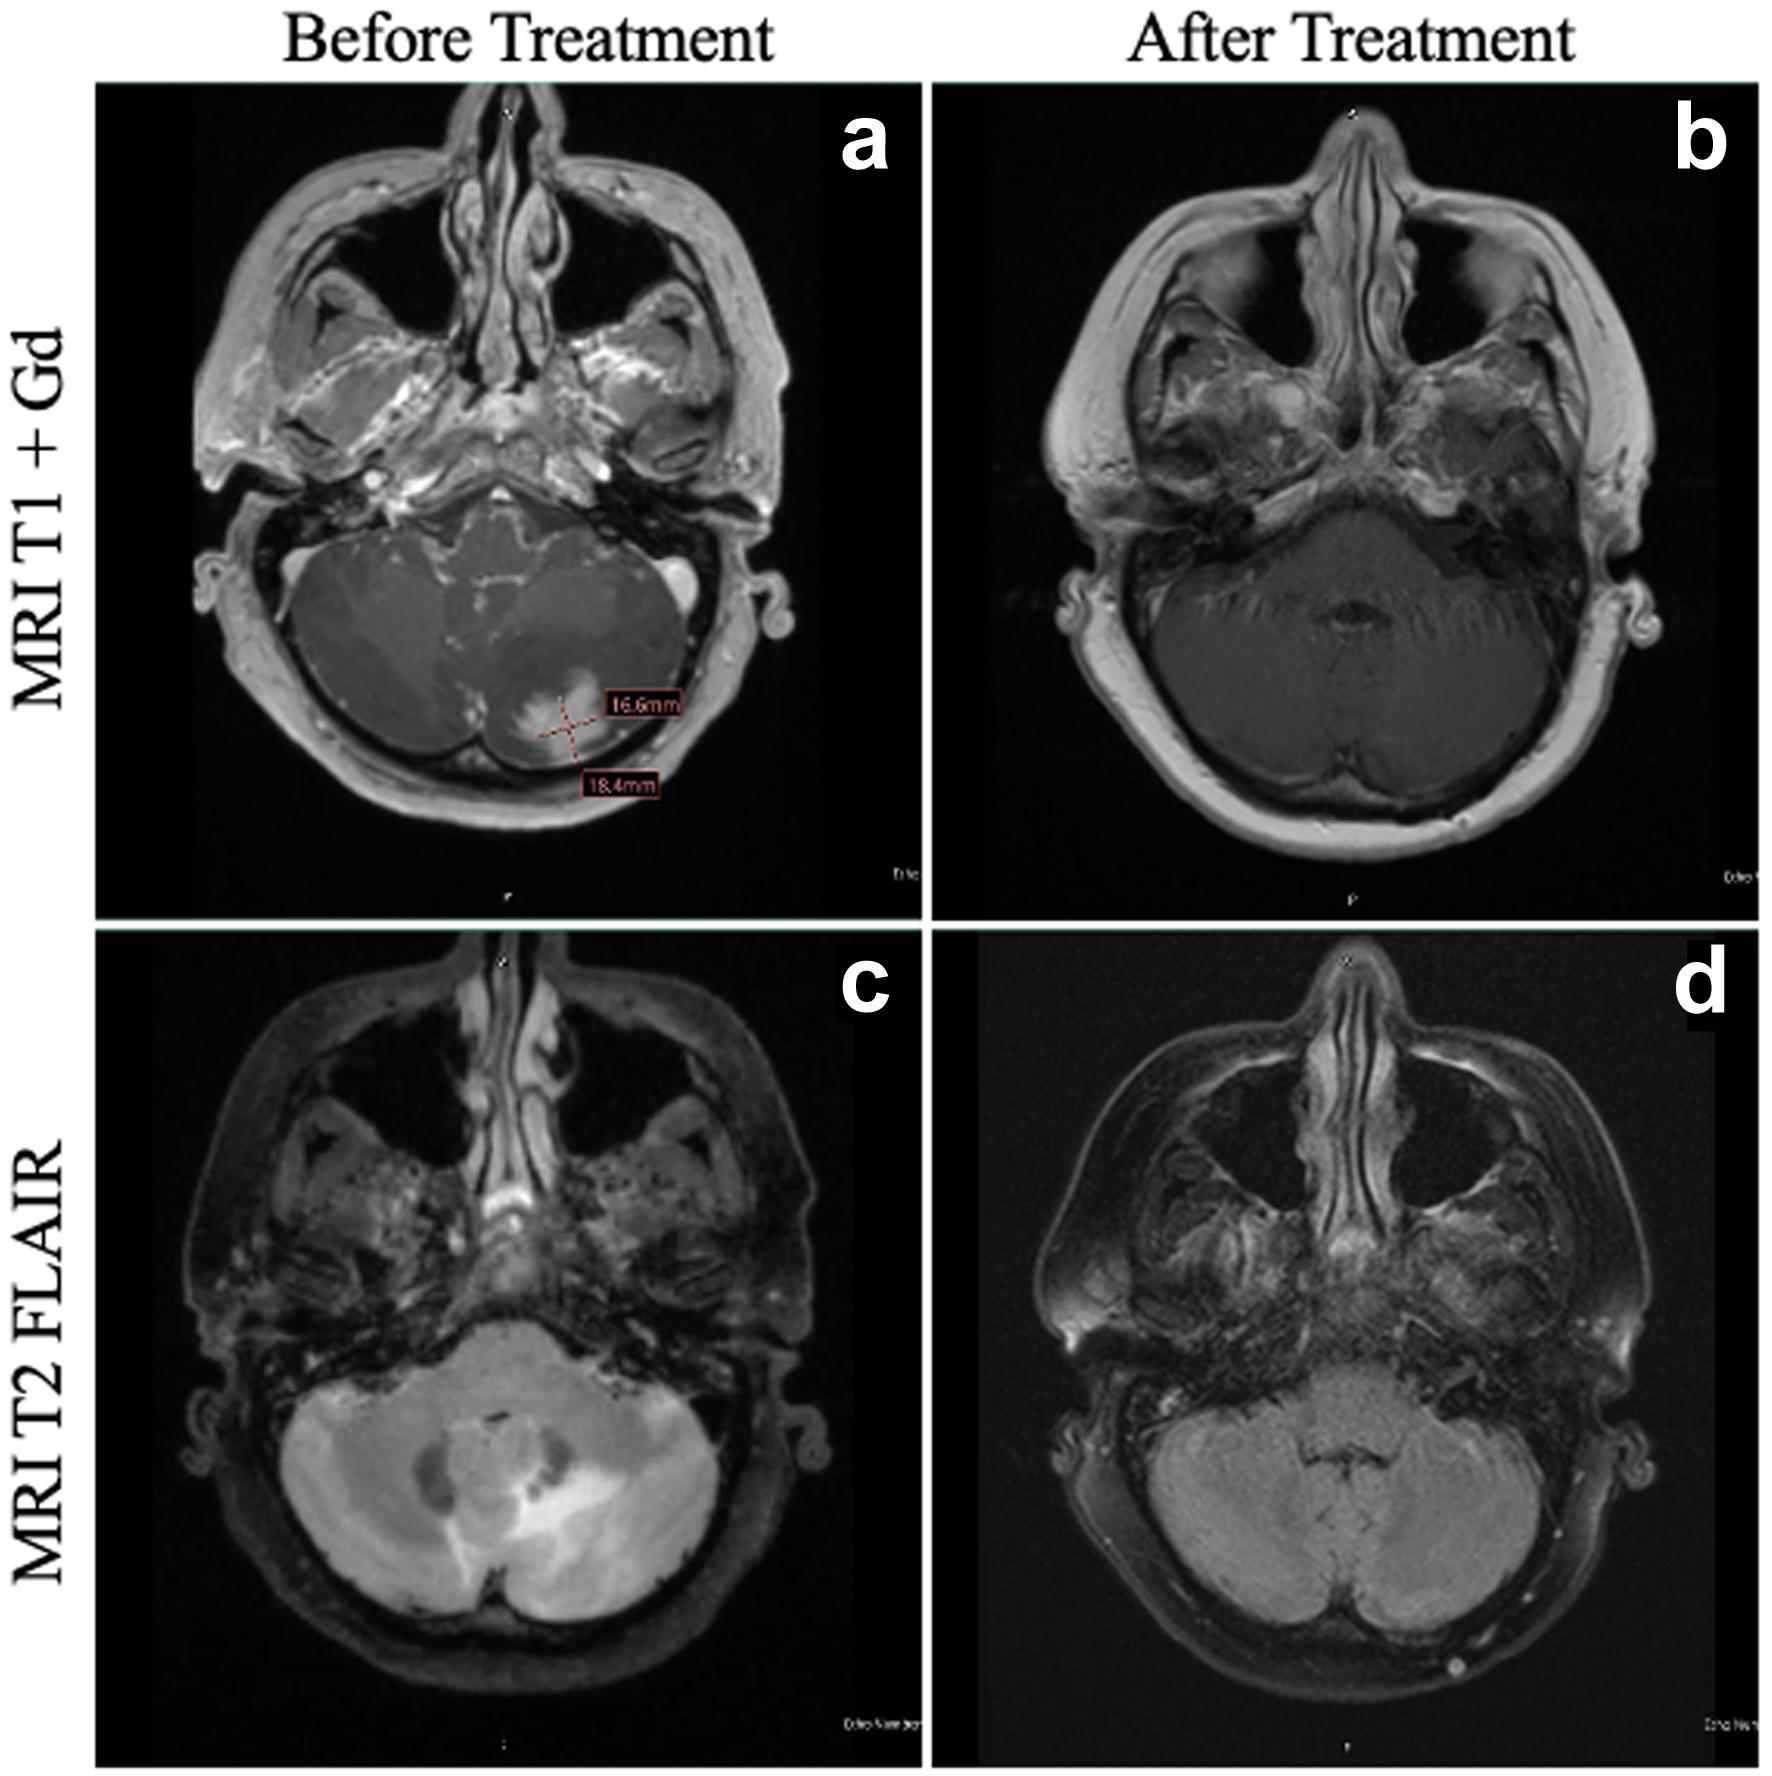
↓ Figure 1. MRI of the patient’s brain
before and after HDC-ASCT. At the time of diagnosis of PCNSTL, the patient had a lesion in the left
cerebellum on T1 + Gd (a), with significant vasogenic edema evident on T2 FLAIR (c). At 1 year following
HDC-ASCT, the patient has complete resolution of both the area of the primary cerebellar lesion (b) as
well as total resolution of vasogenic edema (d). FLAIR: fluid-attenuated inversion recovery; HDC-ASCT:
high-dose chemotherapy followed by autologous stem cell transplantation; MRI: magnetic resonance
imaging; PCNSTL: primary CNS T-cell lymphoma.
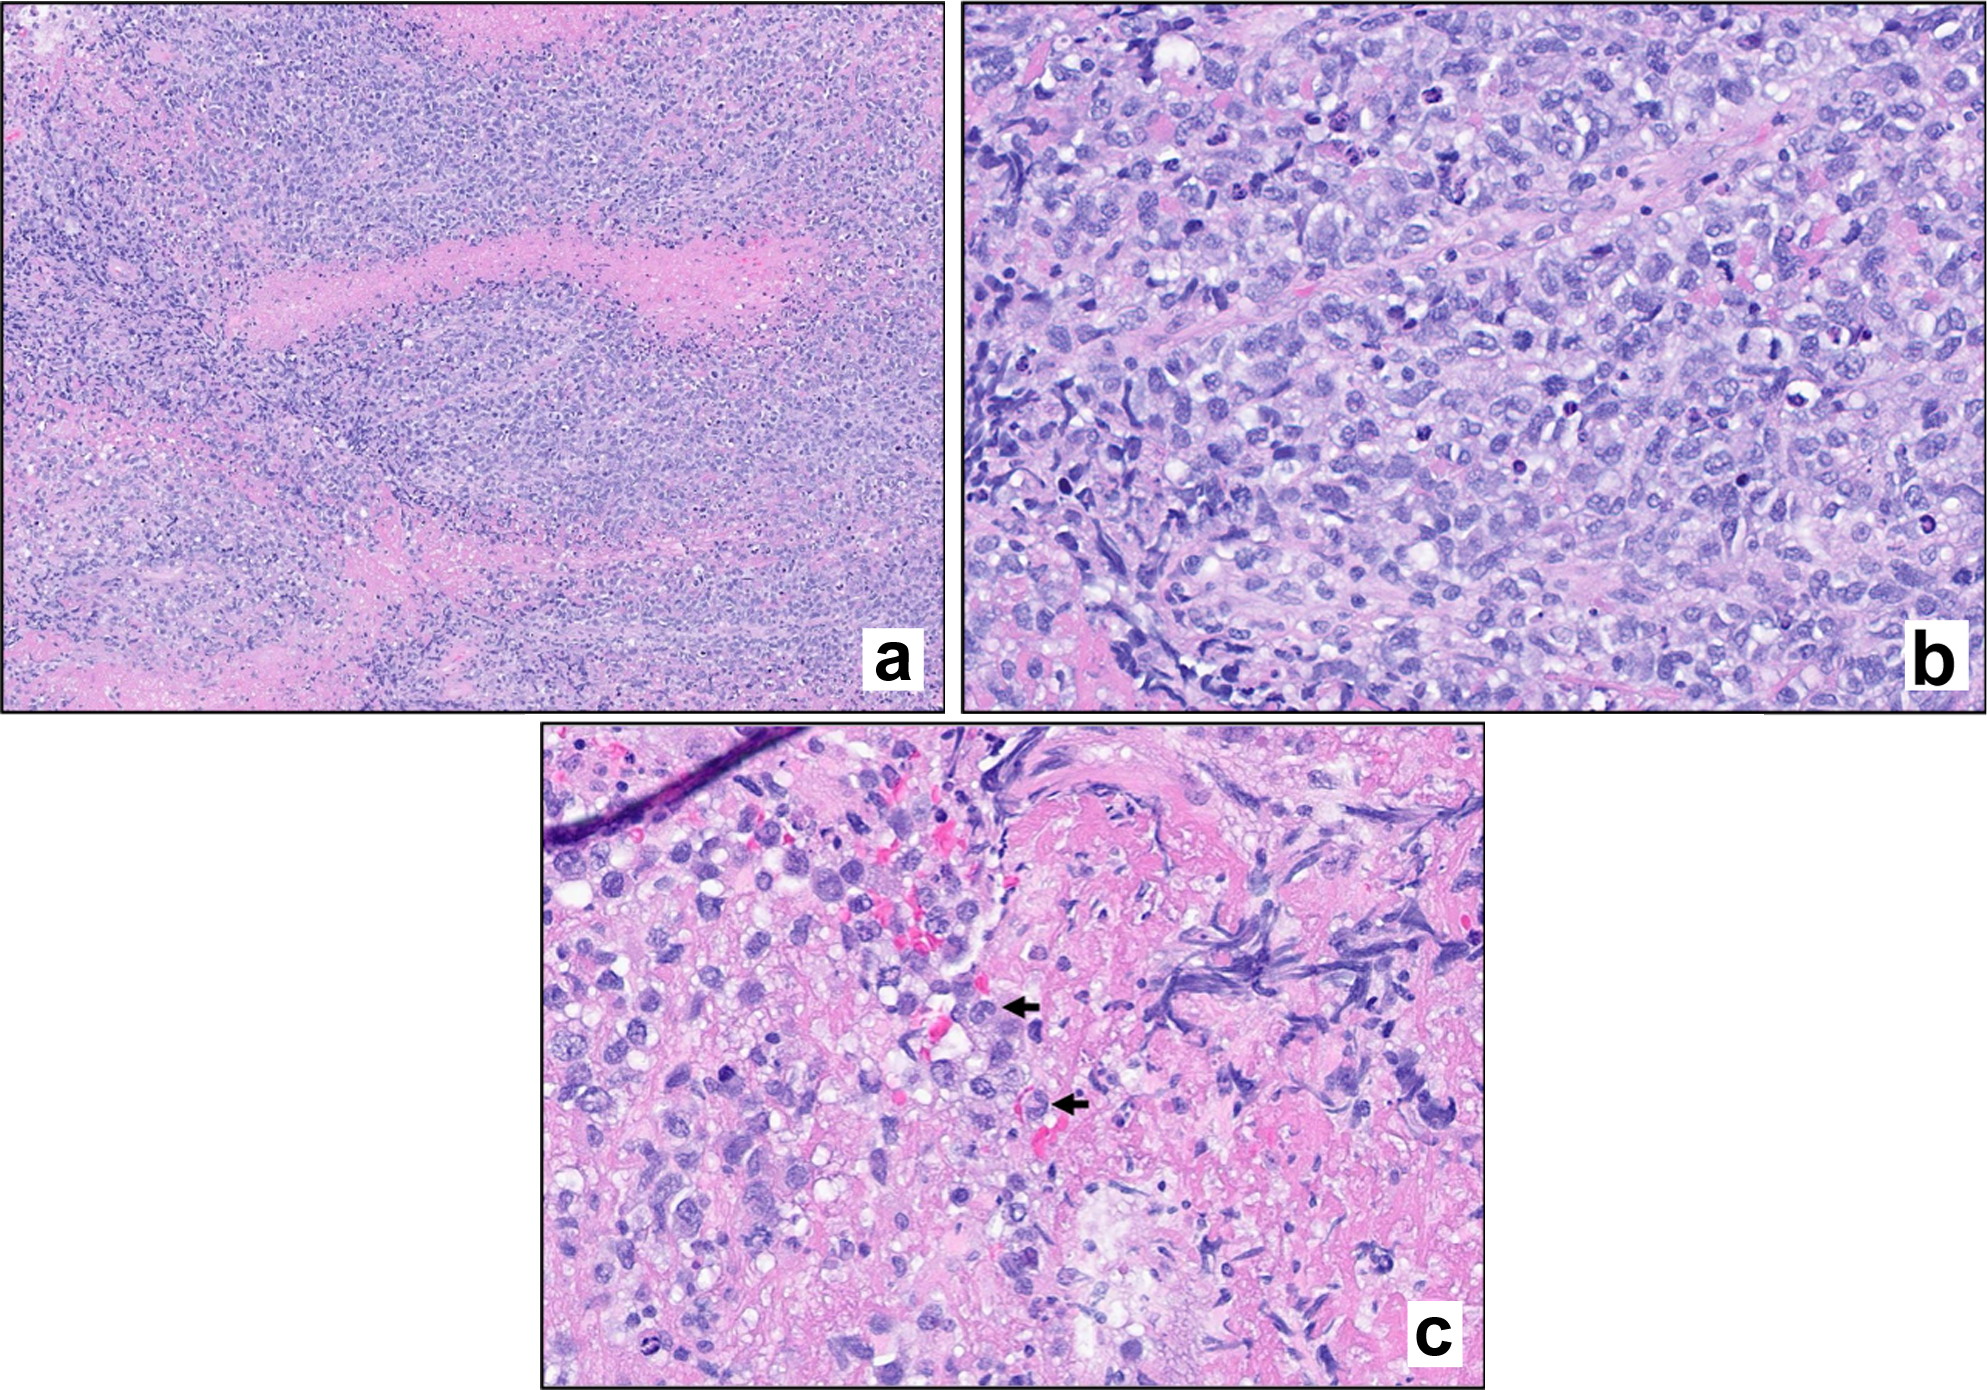
↓ Figure 2. Hematoxylin and eosin (H&E)
stain. Stained sections reveal fragments of brain parenchyma with a diffuse infiltrate of large atypical
lymphoid cells. Mitotic figures are evident (a, × 100 magnification; b, × 400 magnification).
Scattered cells exhibit morphologic features consistent with hallmark cells (c, arrows).
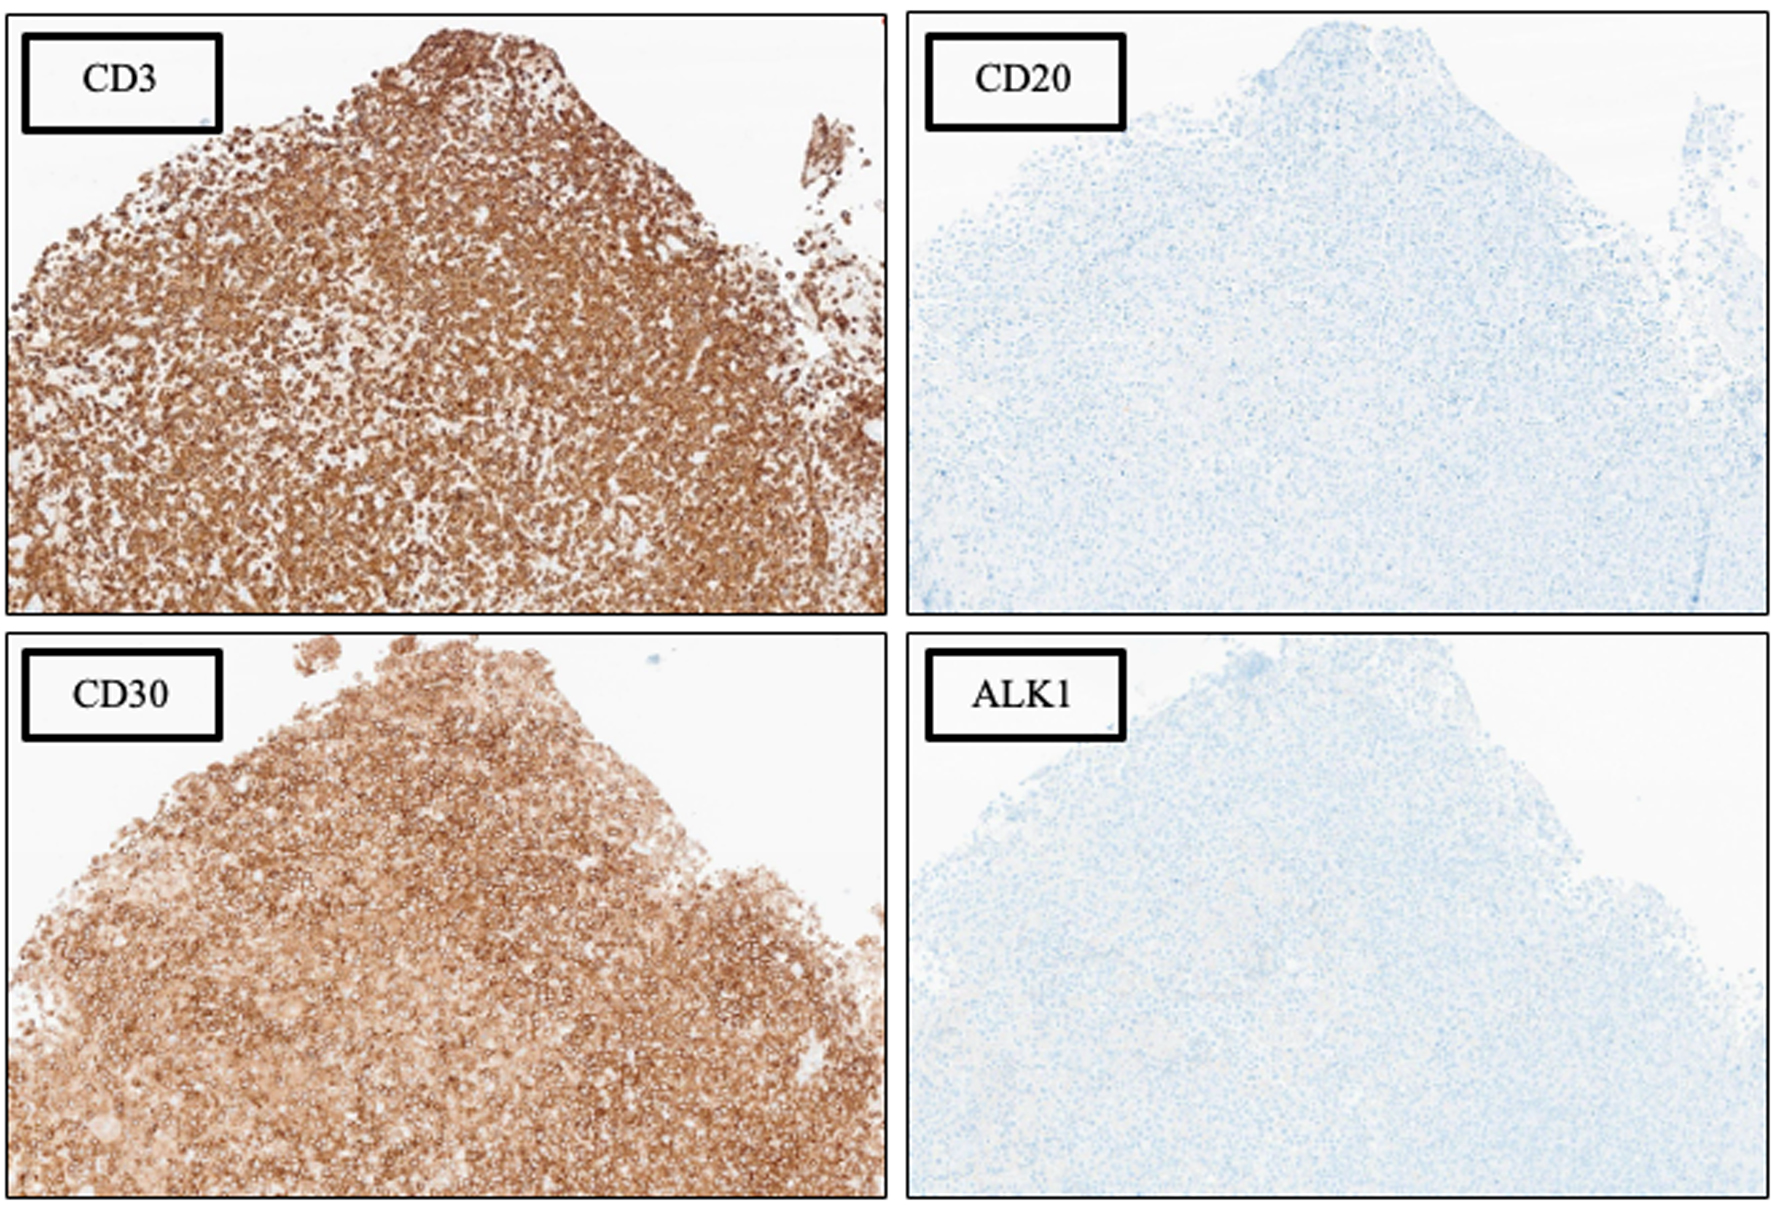
↓ Figure 3. Phenotypic characterization by
immunohistochemical (IHC) analysis, × 100 magnification. See Table 1 for additional IHC
findings.
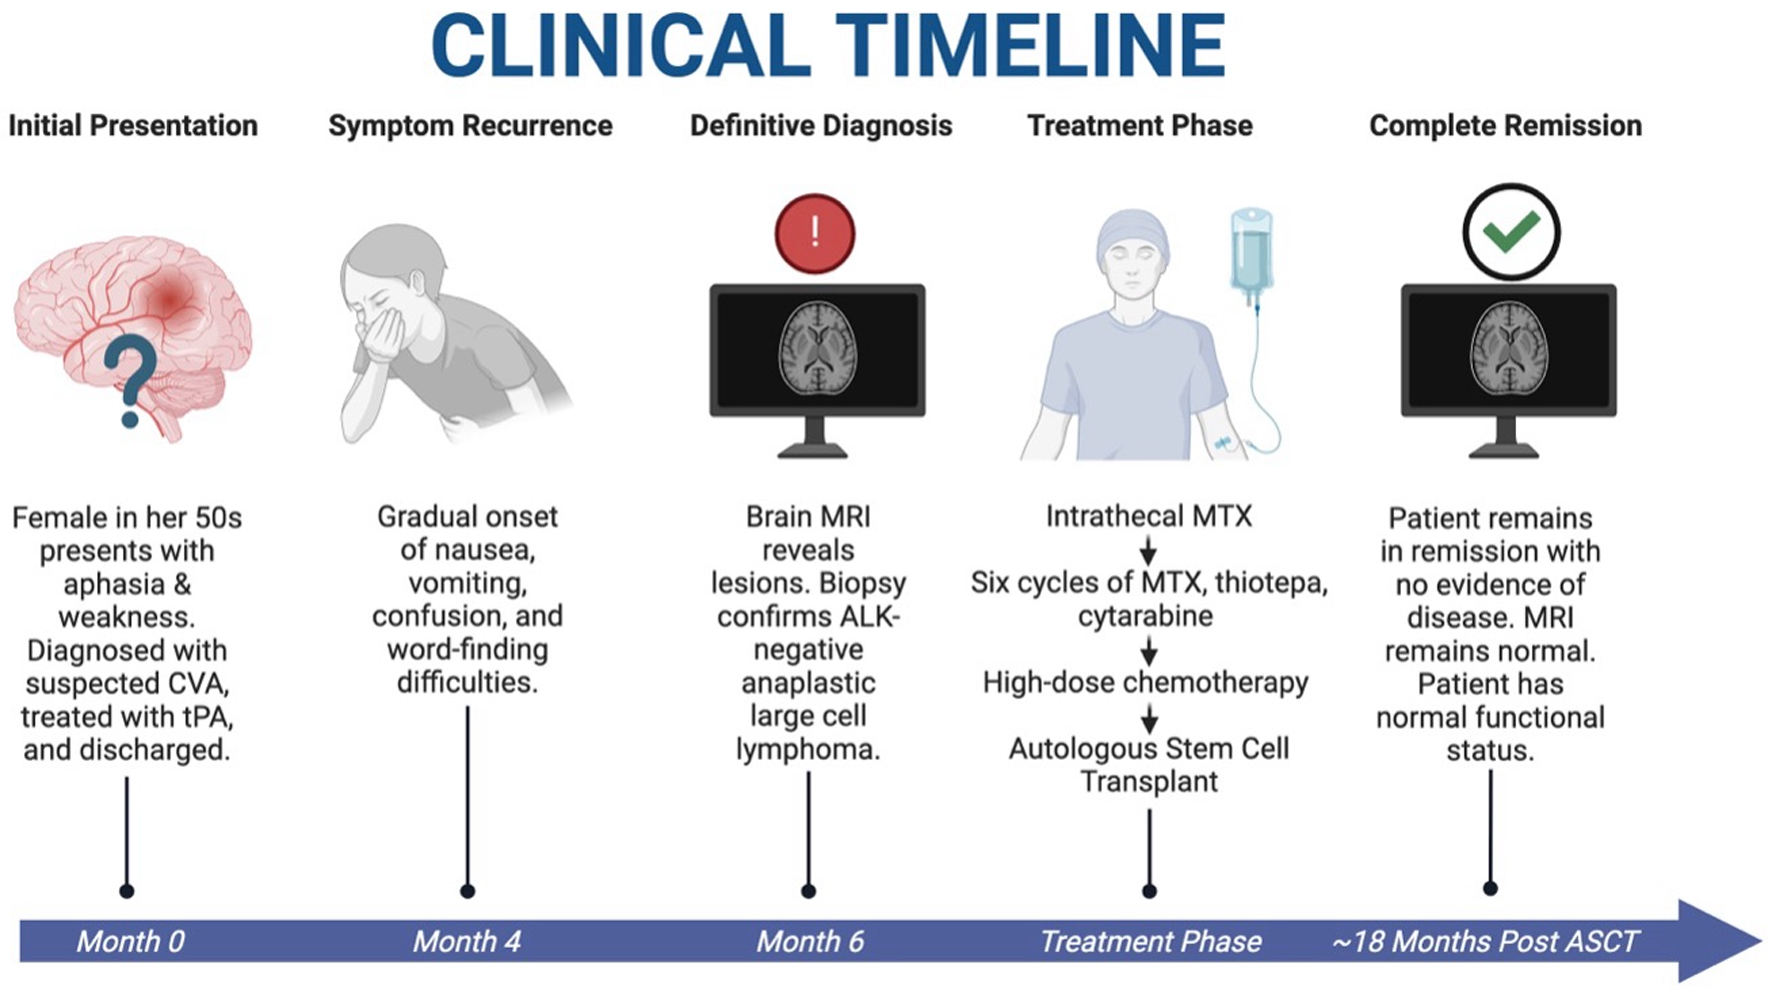
↓ Figure 4. Clinical timeline of case. A patient
with initial stroke-like symptoms was found to have PCNSTL. She underwent HDC-ASCT and is currently in
complete remission with resolution of symptoms and restoration of normal functional status at
approximately 18 months after HDC-ASCT. HDC-ASCT: high-dose chemotherapy followed by autologous stem
cell transplantation; PCNSTL: primary CNS T-cell lymphoma. Created in BioRender. Holley, N. (2025)
https://BioRender.com/kdfox90.
Table
↓ Table 1. Additional Immunohistochemical and in situ Hybridization
Results
|
Positive markers |
Negative markers |
| EBER ISH: Epstein-Barr virus-encoded RNA in situ hybridization. |
| CD2 (weak) |
CD5 |
| CD4 (minor subset) |
CD8 |
| CD7 |
CD10 |
| CD43 |
CD15 |
| CD56 (weak) |
CD34 |
| Ki67 (> 95%) |
CD138 |
| PD1 (subset) |
EBER ISH |
| TIA1 |
EMA |
|
PAX5 |
|
p63 |