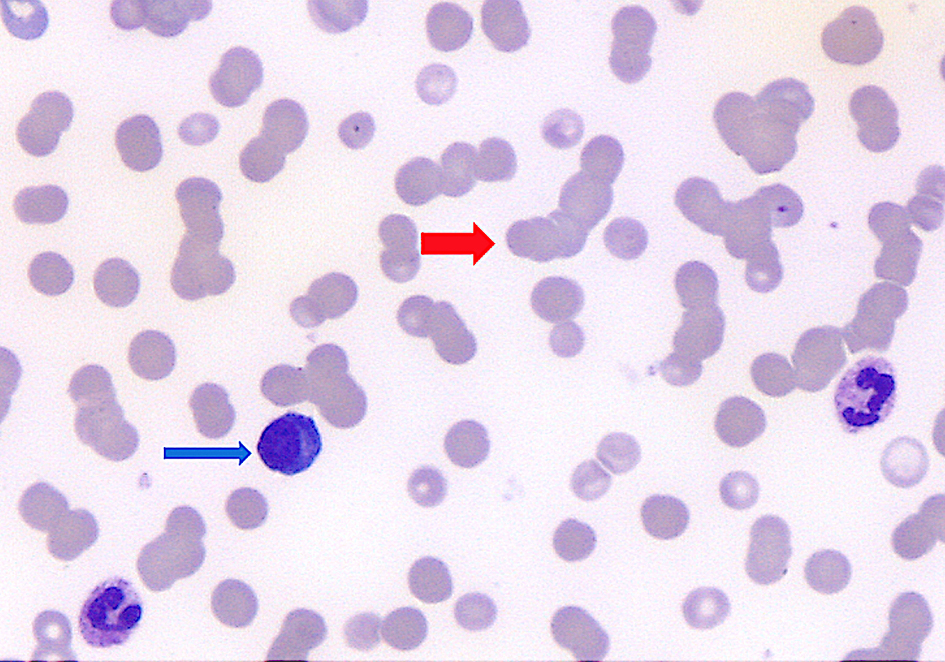
↓ Figure 1. Peripheral blood smear showed
plasmacytoid cells (blue arrow, approximately 5% of white cells) and red cell rouleaux (red arrow).
| Journal of Medical Cases, ISSN 1923-4155 print, 1923-4163 online, Open Access |
| Article copyright, the authors; Journal compilation copyright, J Med Cases and Elmer Press Inc |
| Journal website https://jmc.elmerpub.com |
Case Report
Volume 16, Number 5, May 2025, pages 181-186
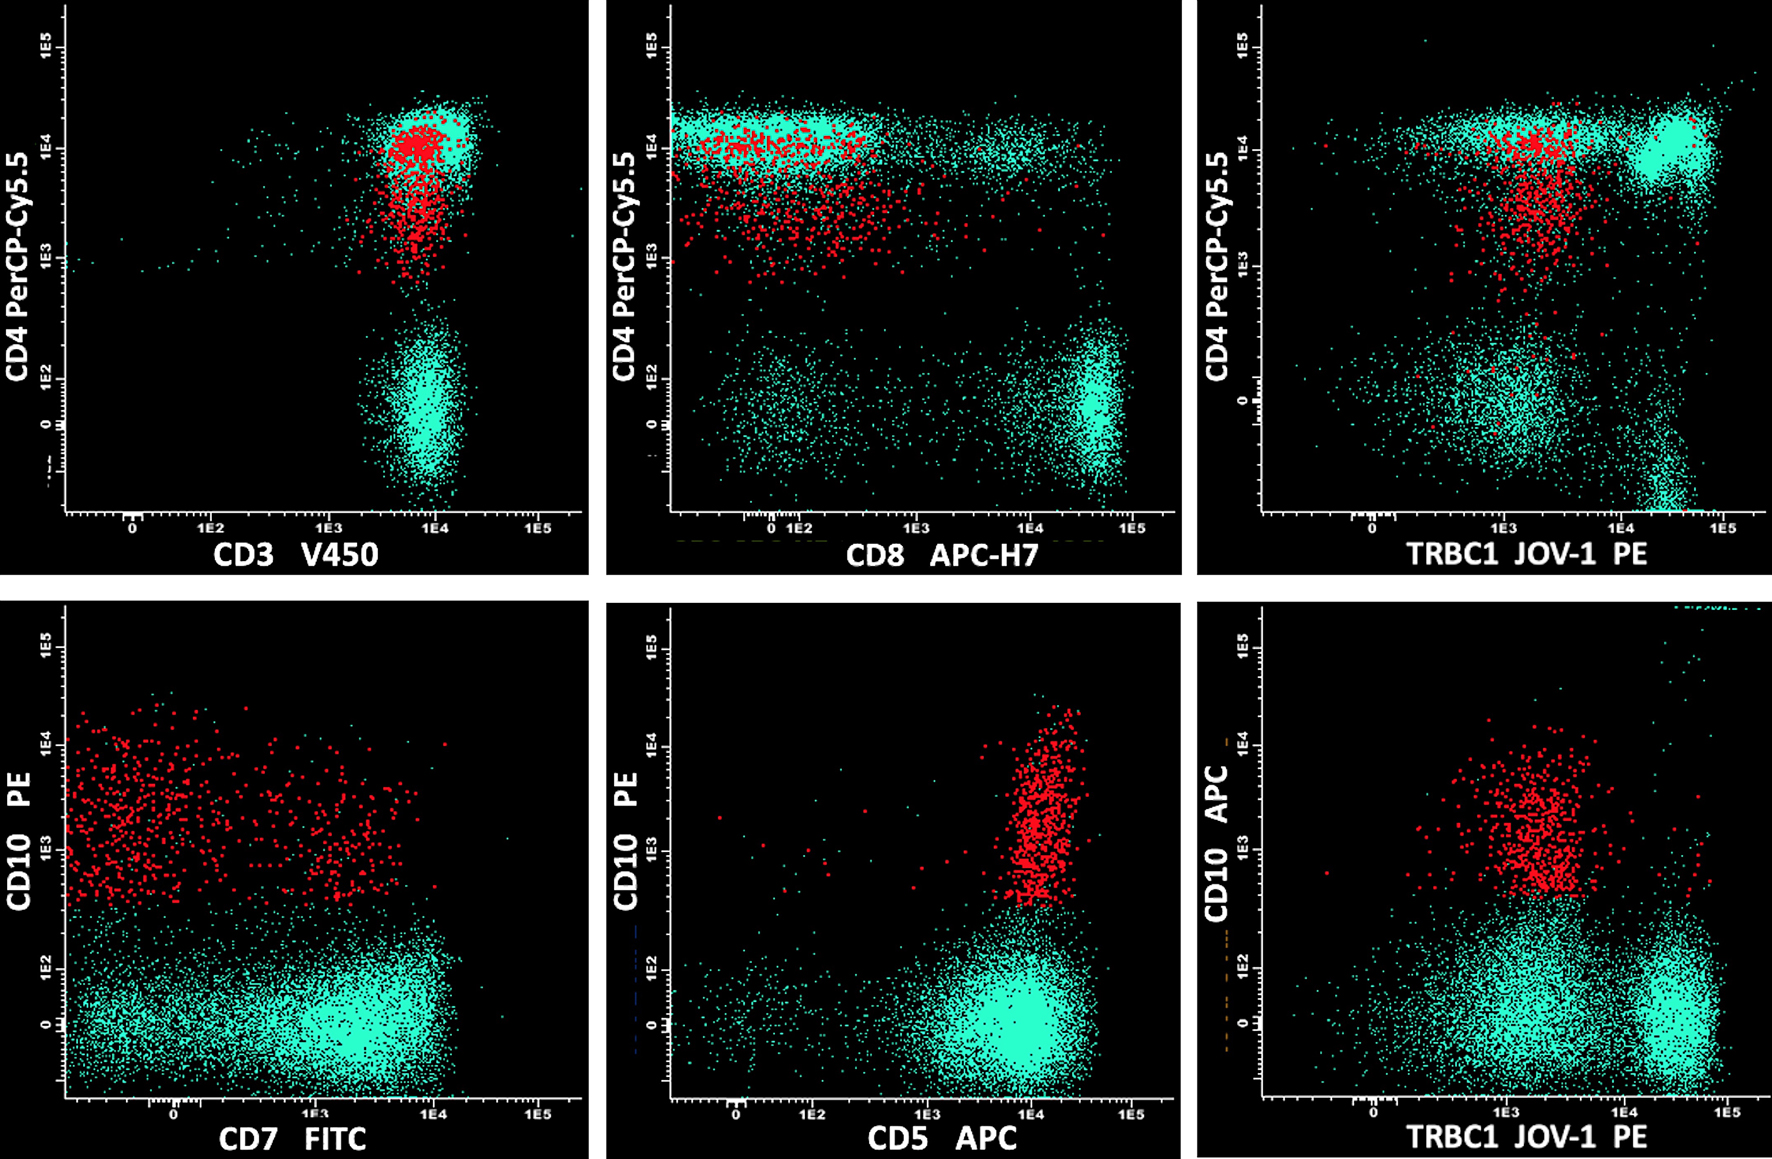
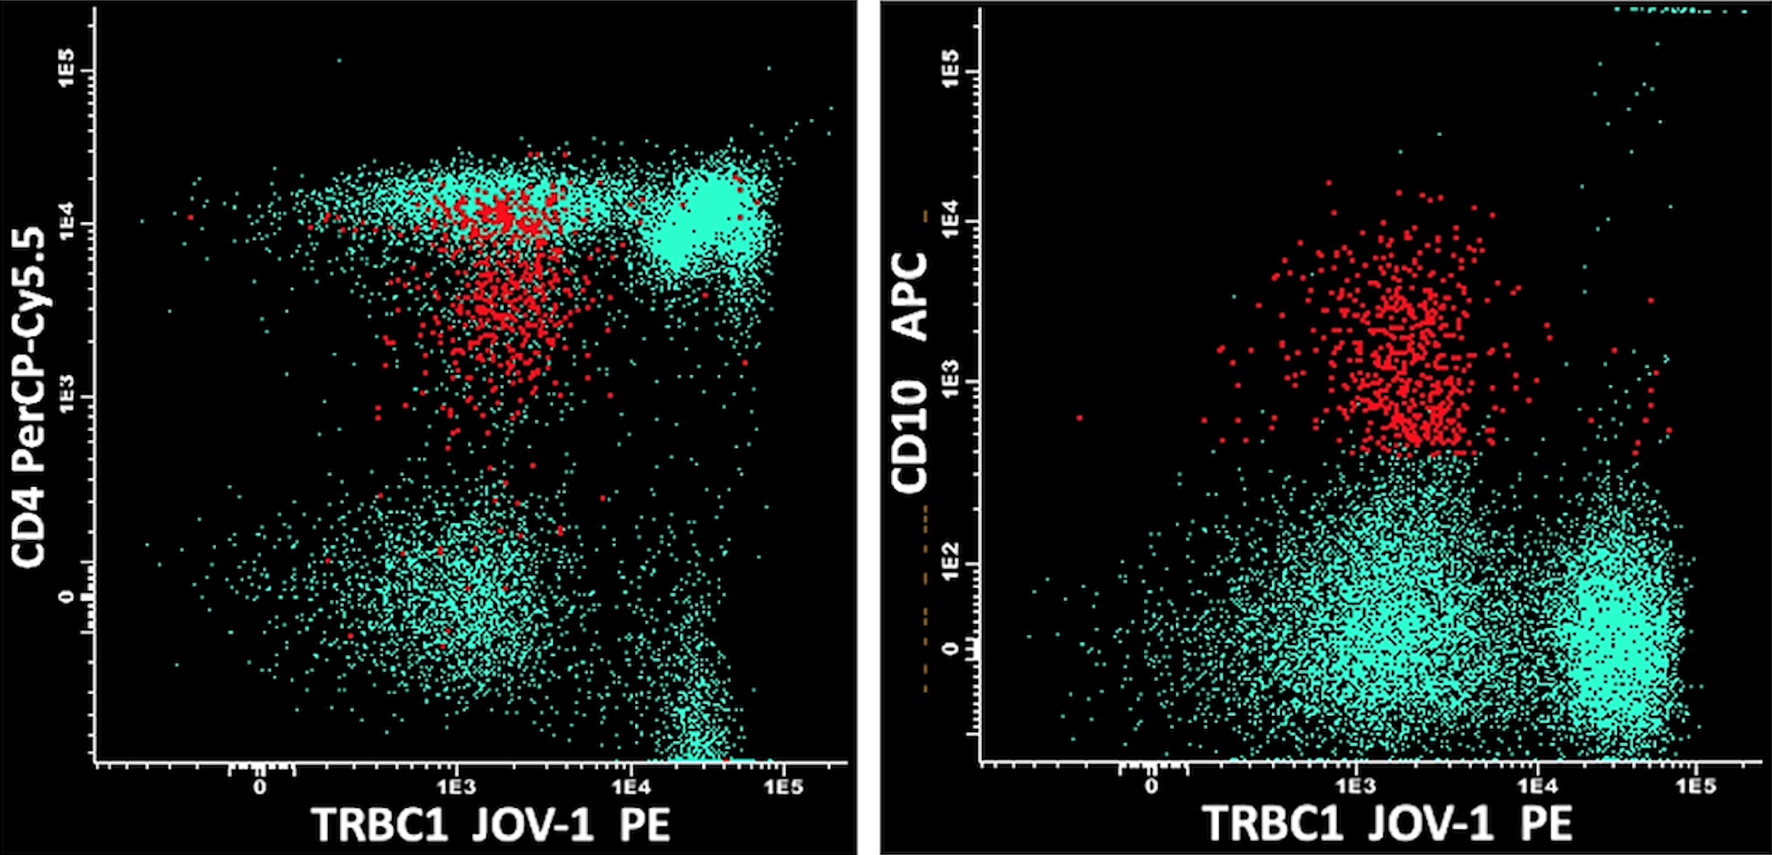
High-Sensitivity Flow Cytometric Detection of a Small Circulating Population of Nodal T-Follicular Helper Cell Lymphoma Angioimmunoblastic Type Cells
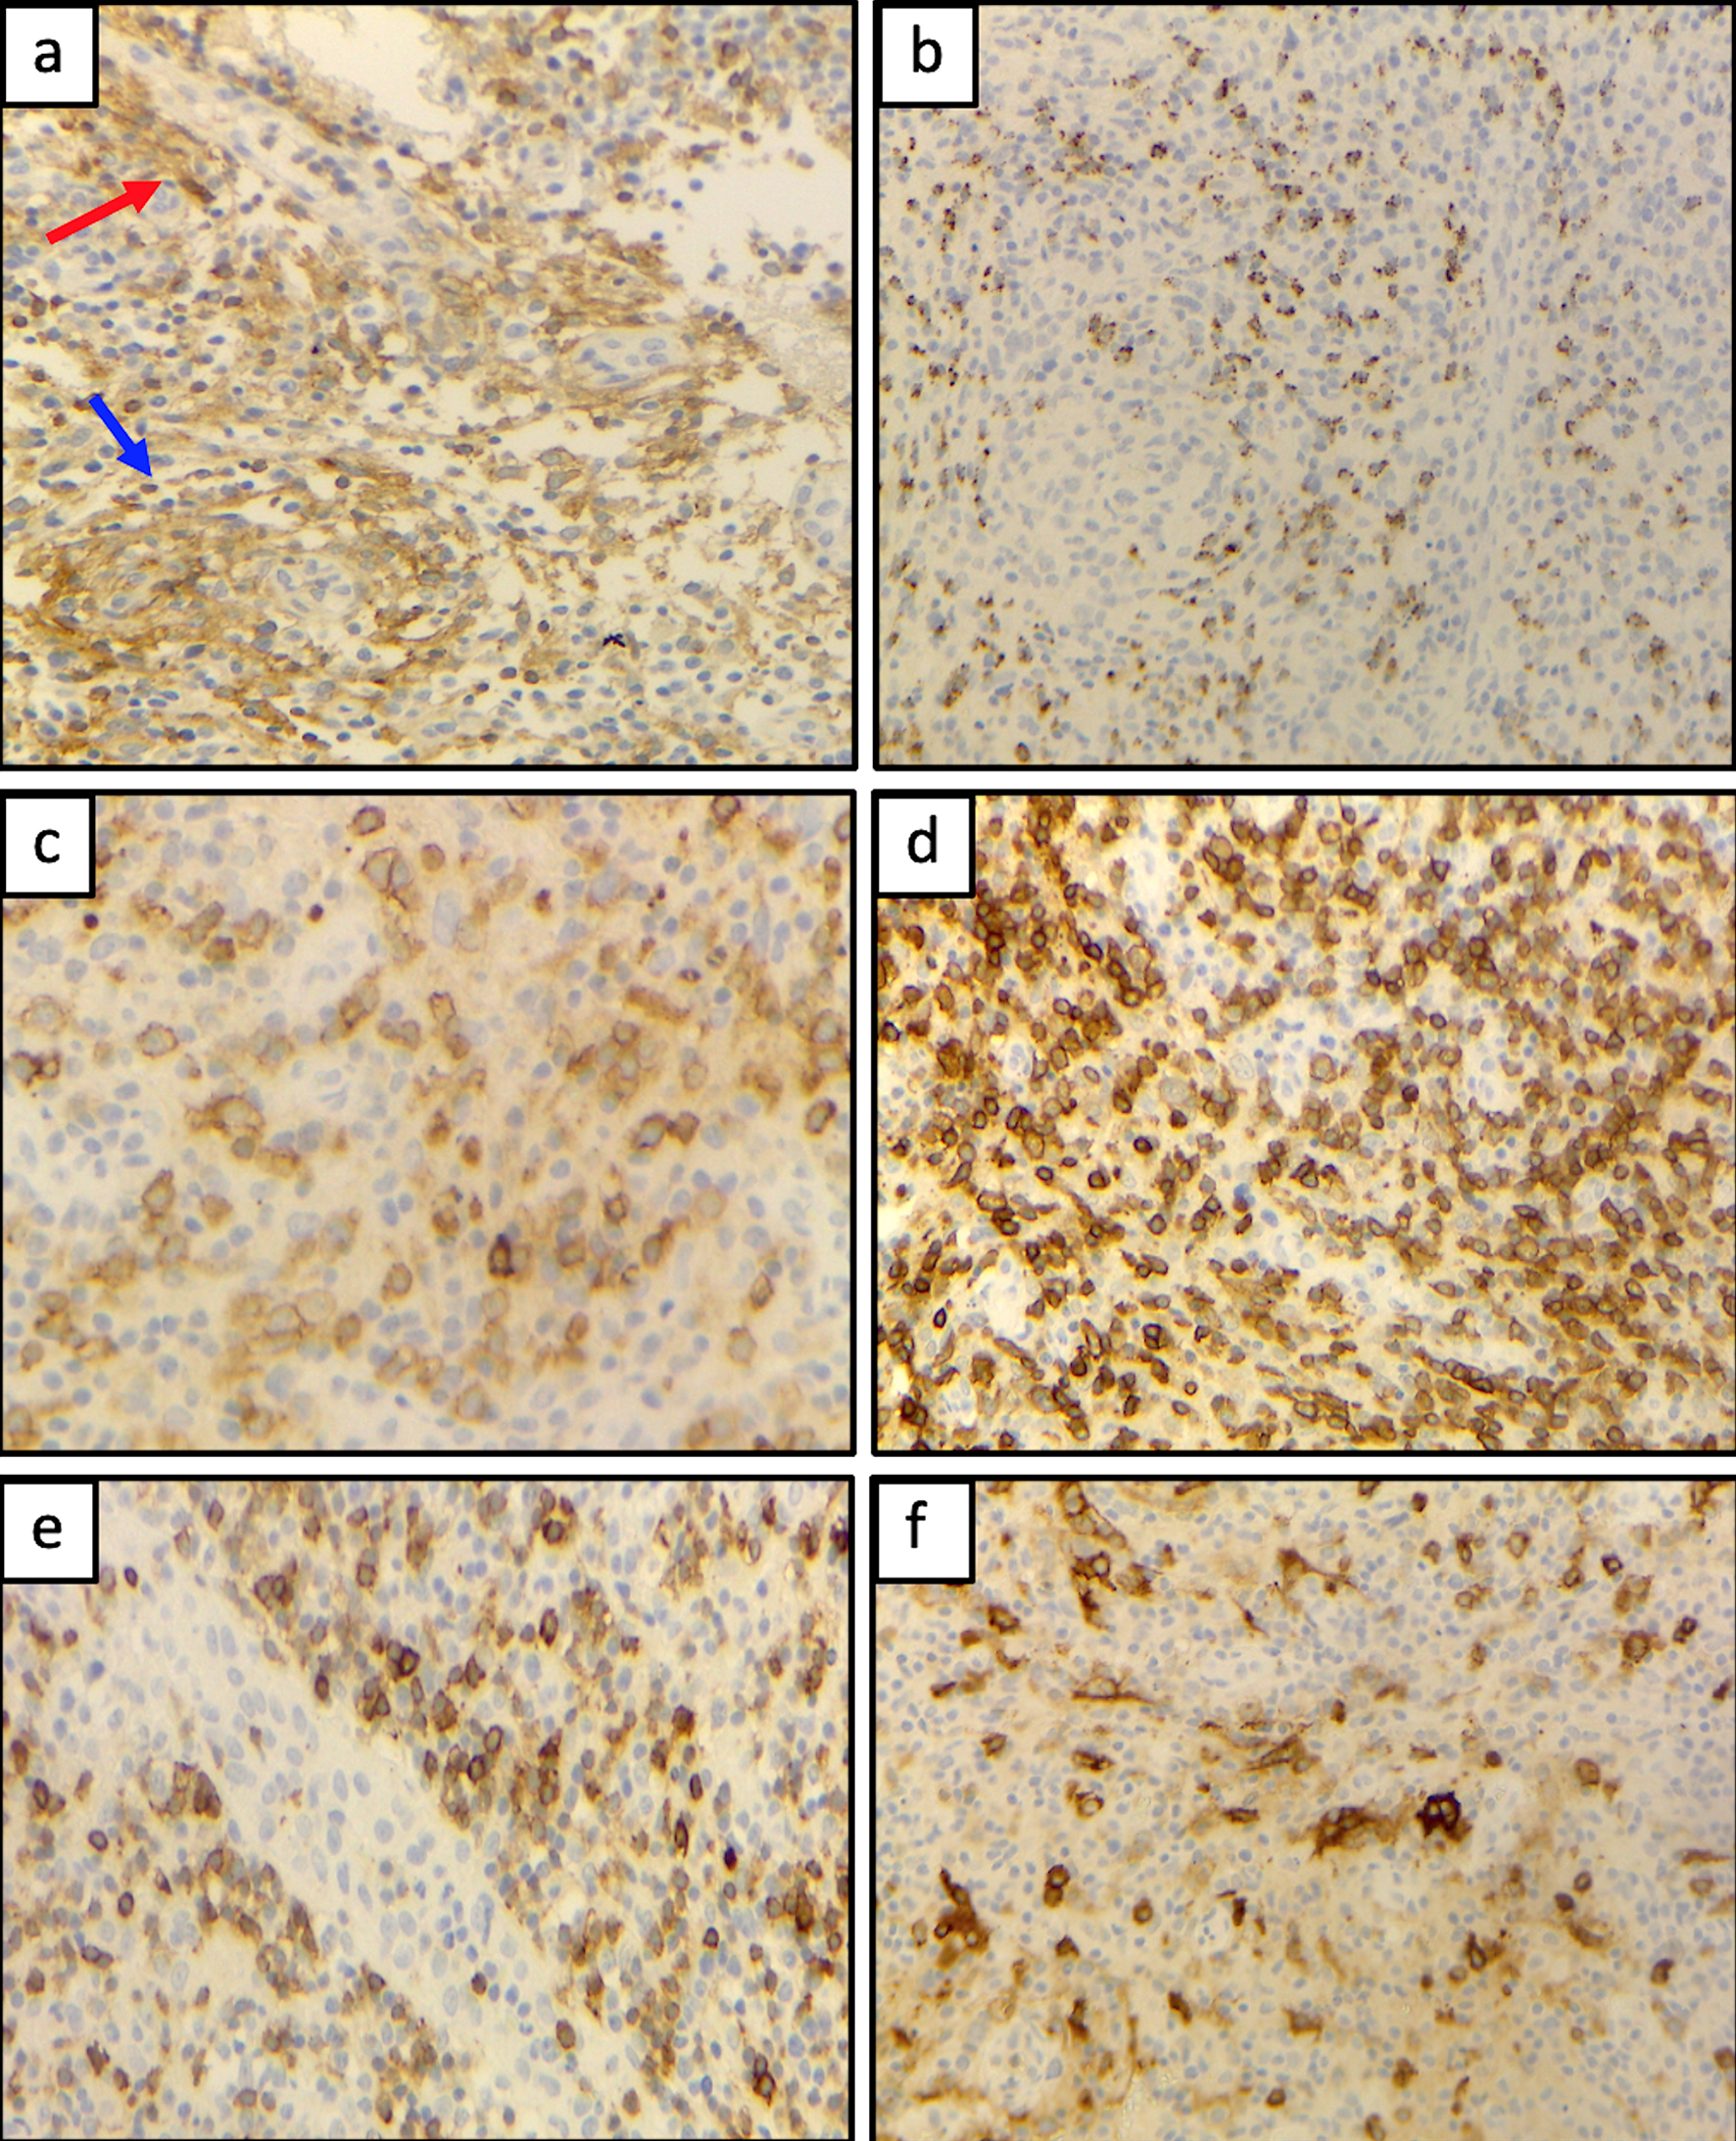
Figures