Figures
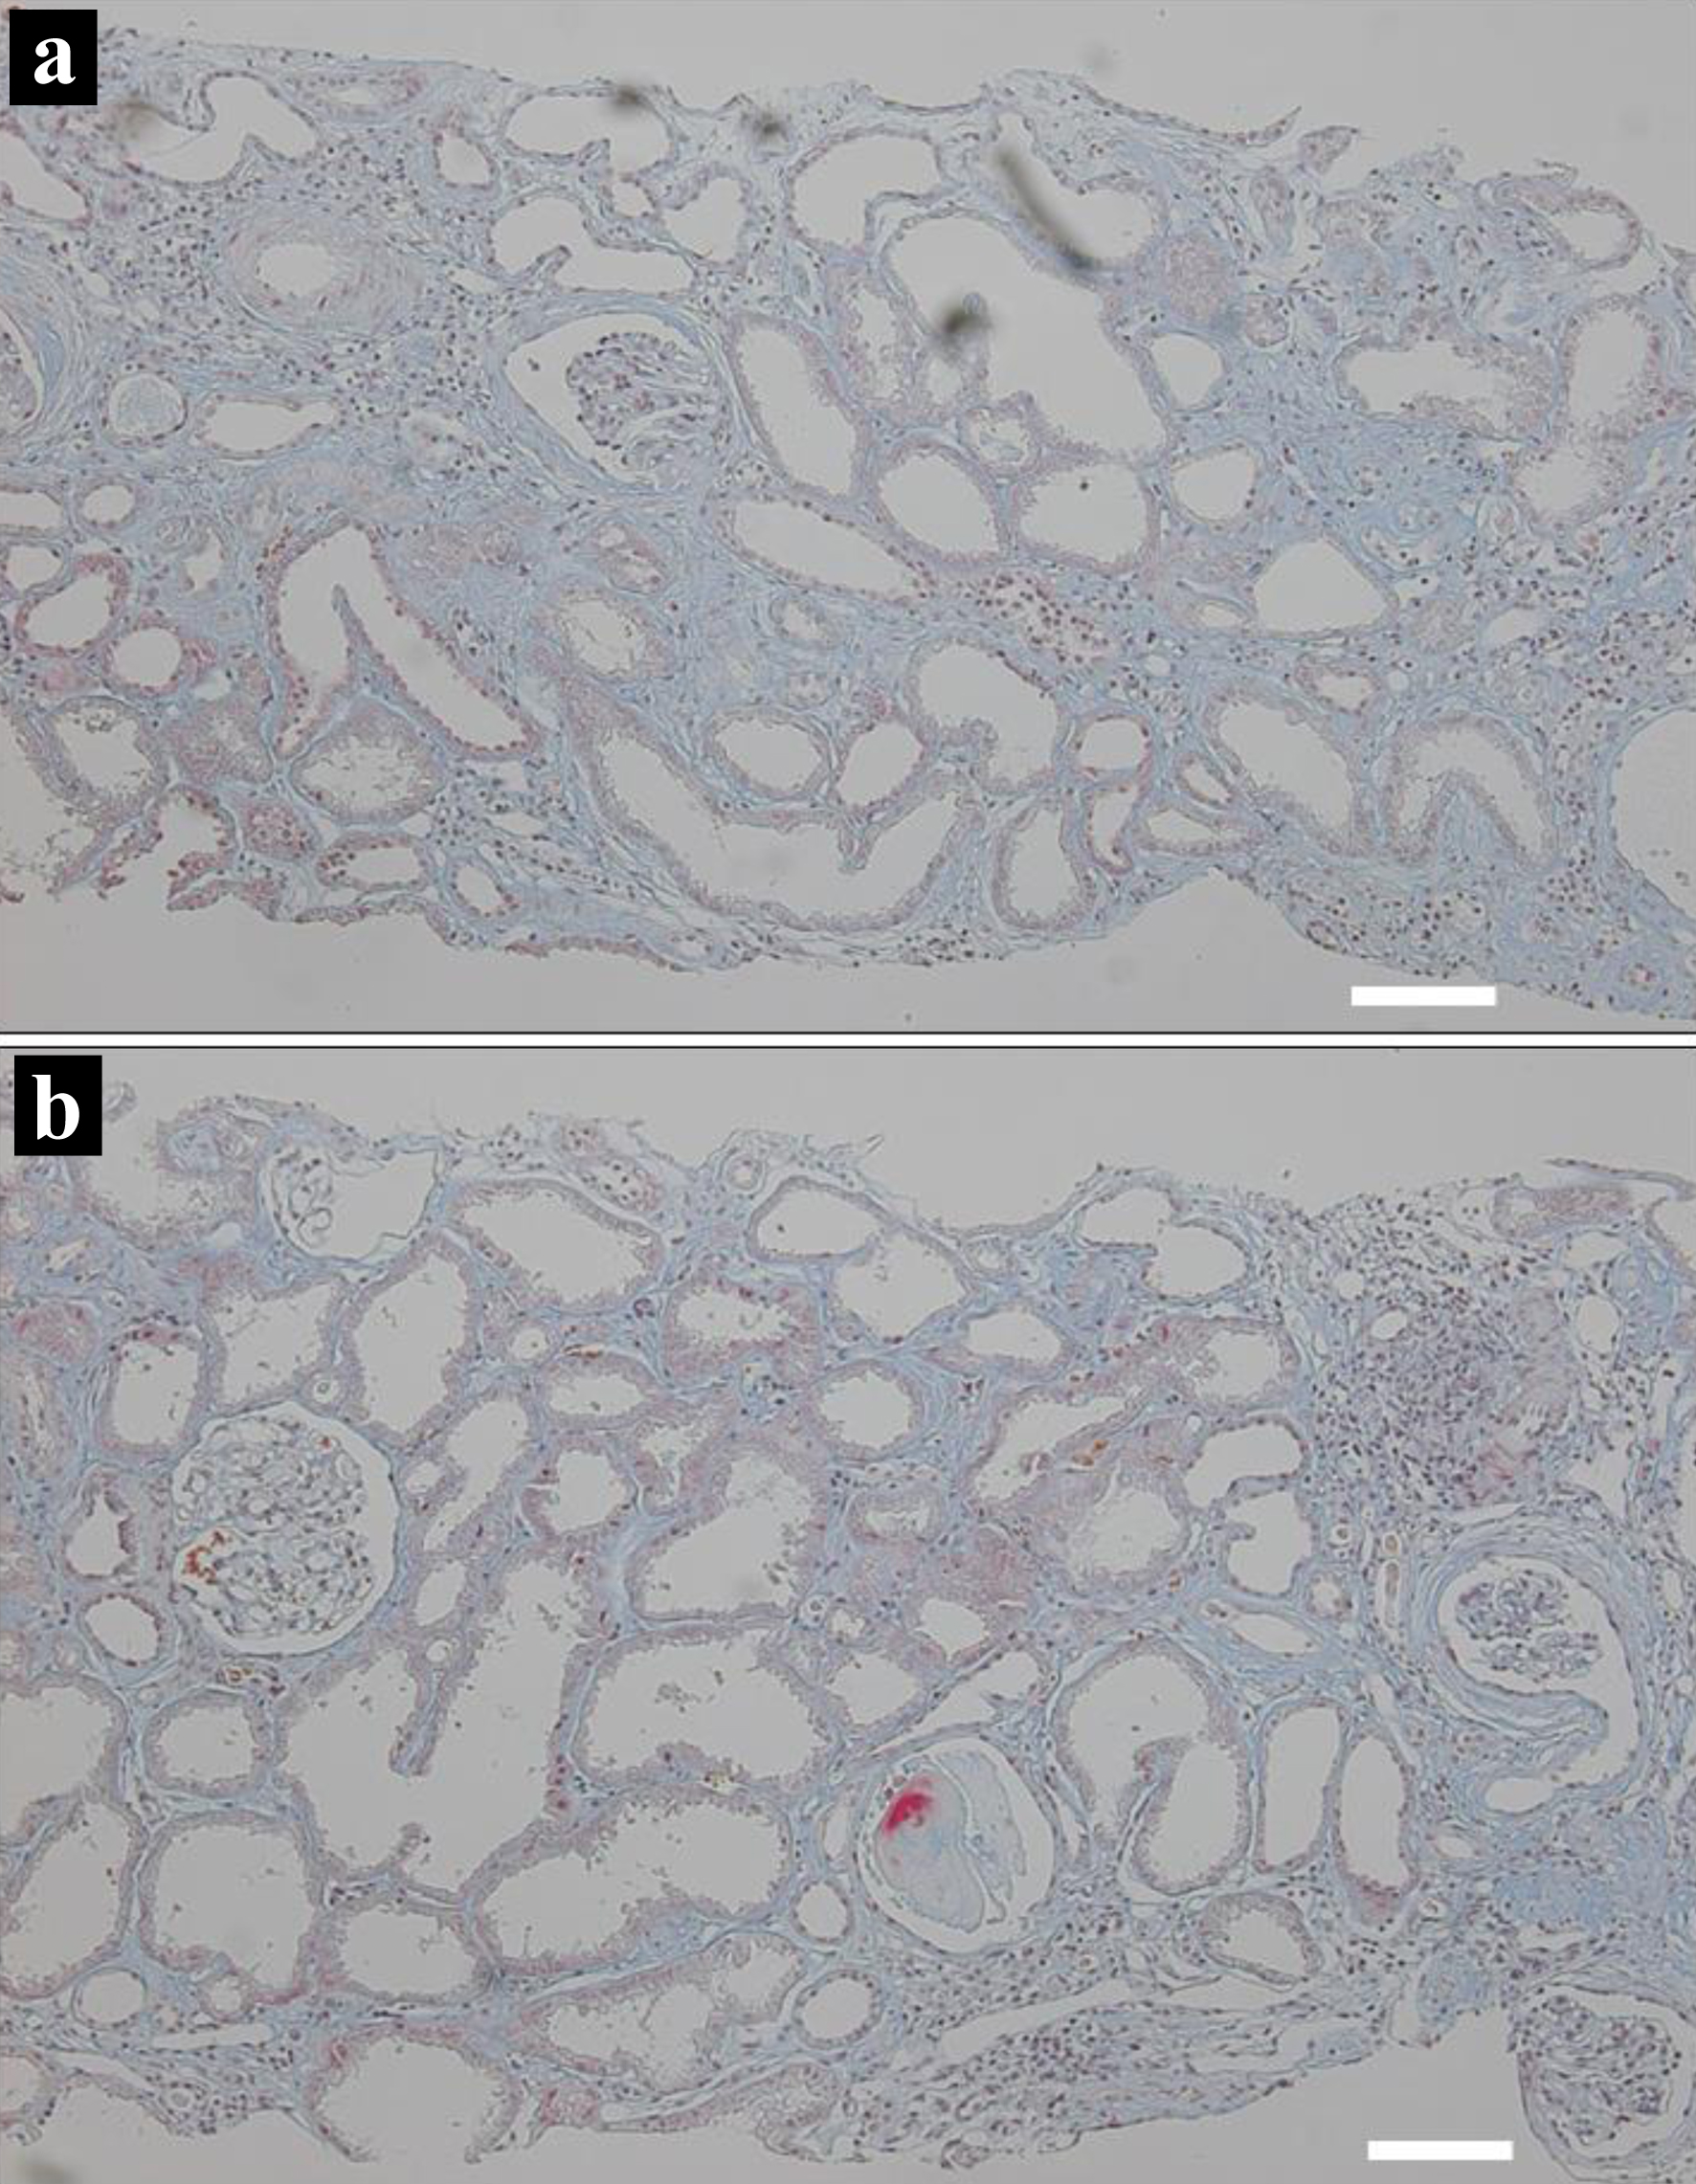
↓ Figure 1. Kidney biopsy at the age of 15 years.
Two microscopic photographs (a, b) with color-faded Masson trichrome staining, showing diffuse
interstitial fibrosis with lymphocytic infiltration, and renal tubular atrophy with irregular dilation.
Scale bar = 100 µm.
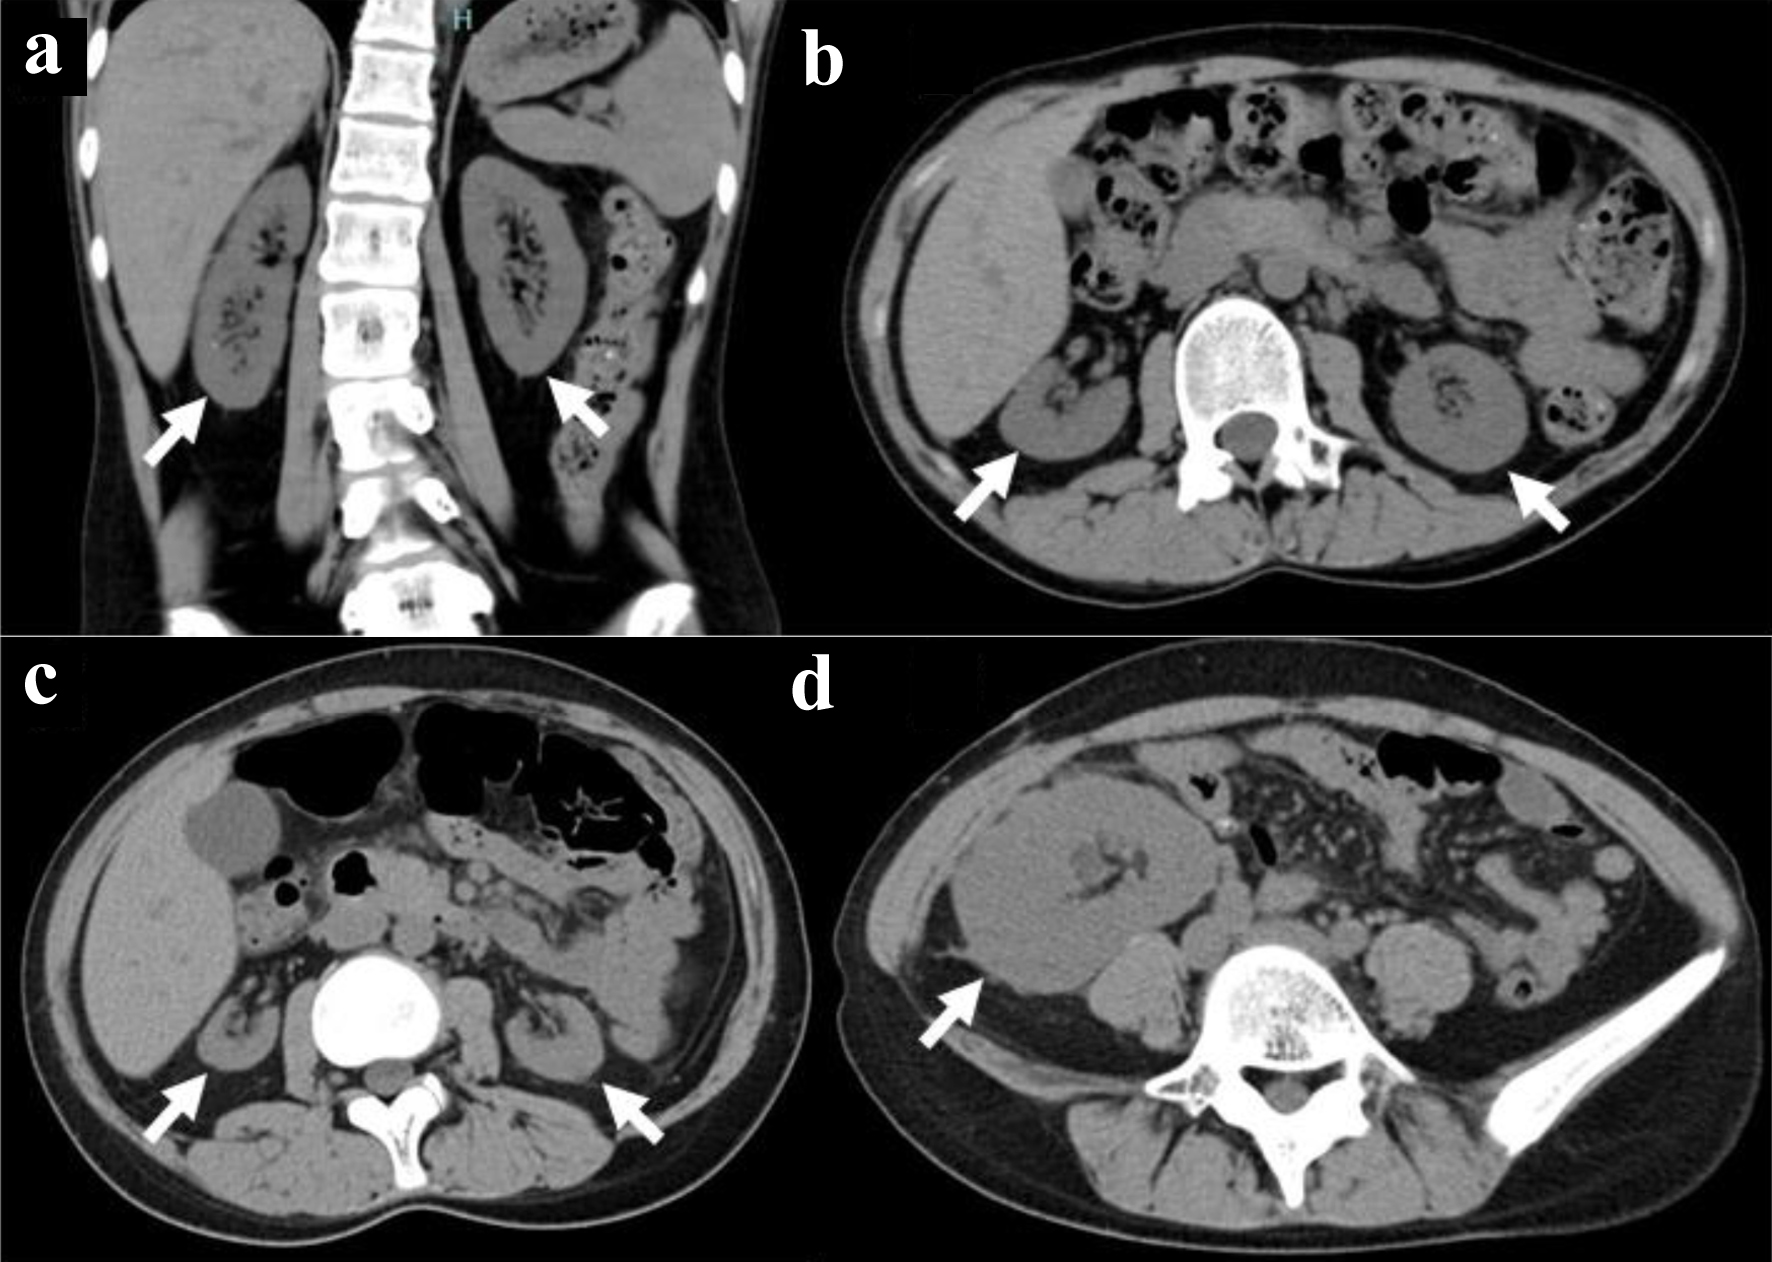
↓ Figure 2. Computed tomography scans. Atrophic
kidneys on both sides in coronal (arrows, a) and axial (arrows, b) images at the age of 18 years before
kidney transplantation. Further atrophied kidneys (arrows, c) and kidney transplant in the normal
dimension (arrow, d) at 19 years old, 8 months after kidney transplantation.
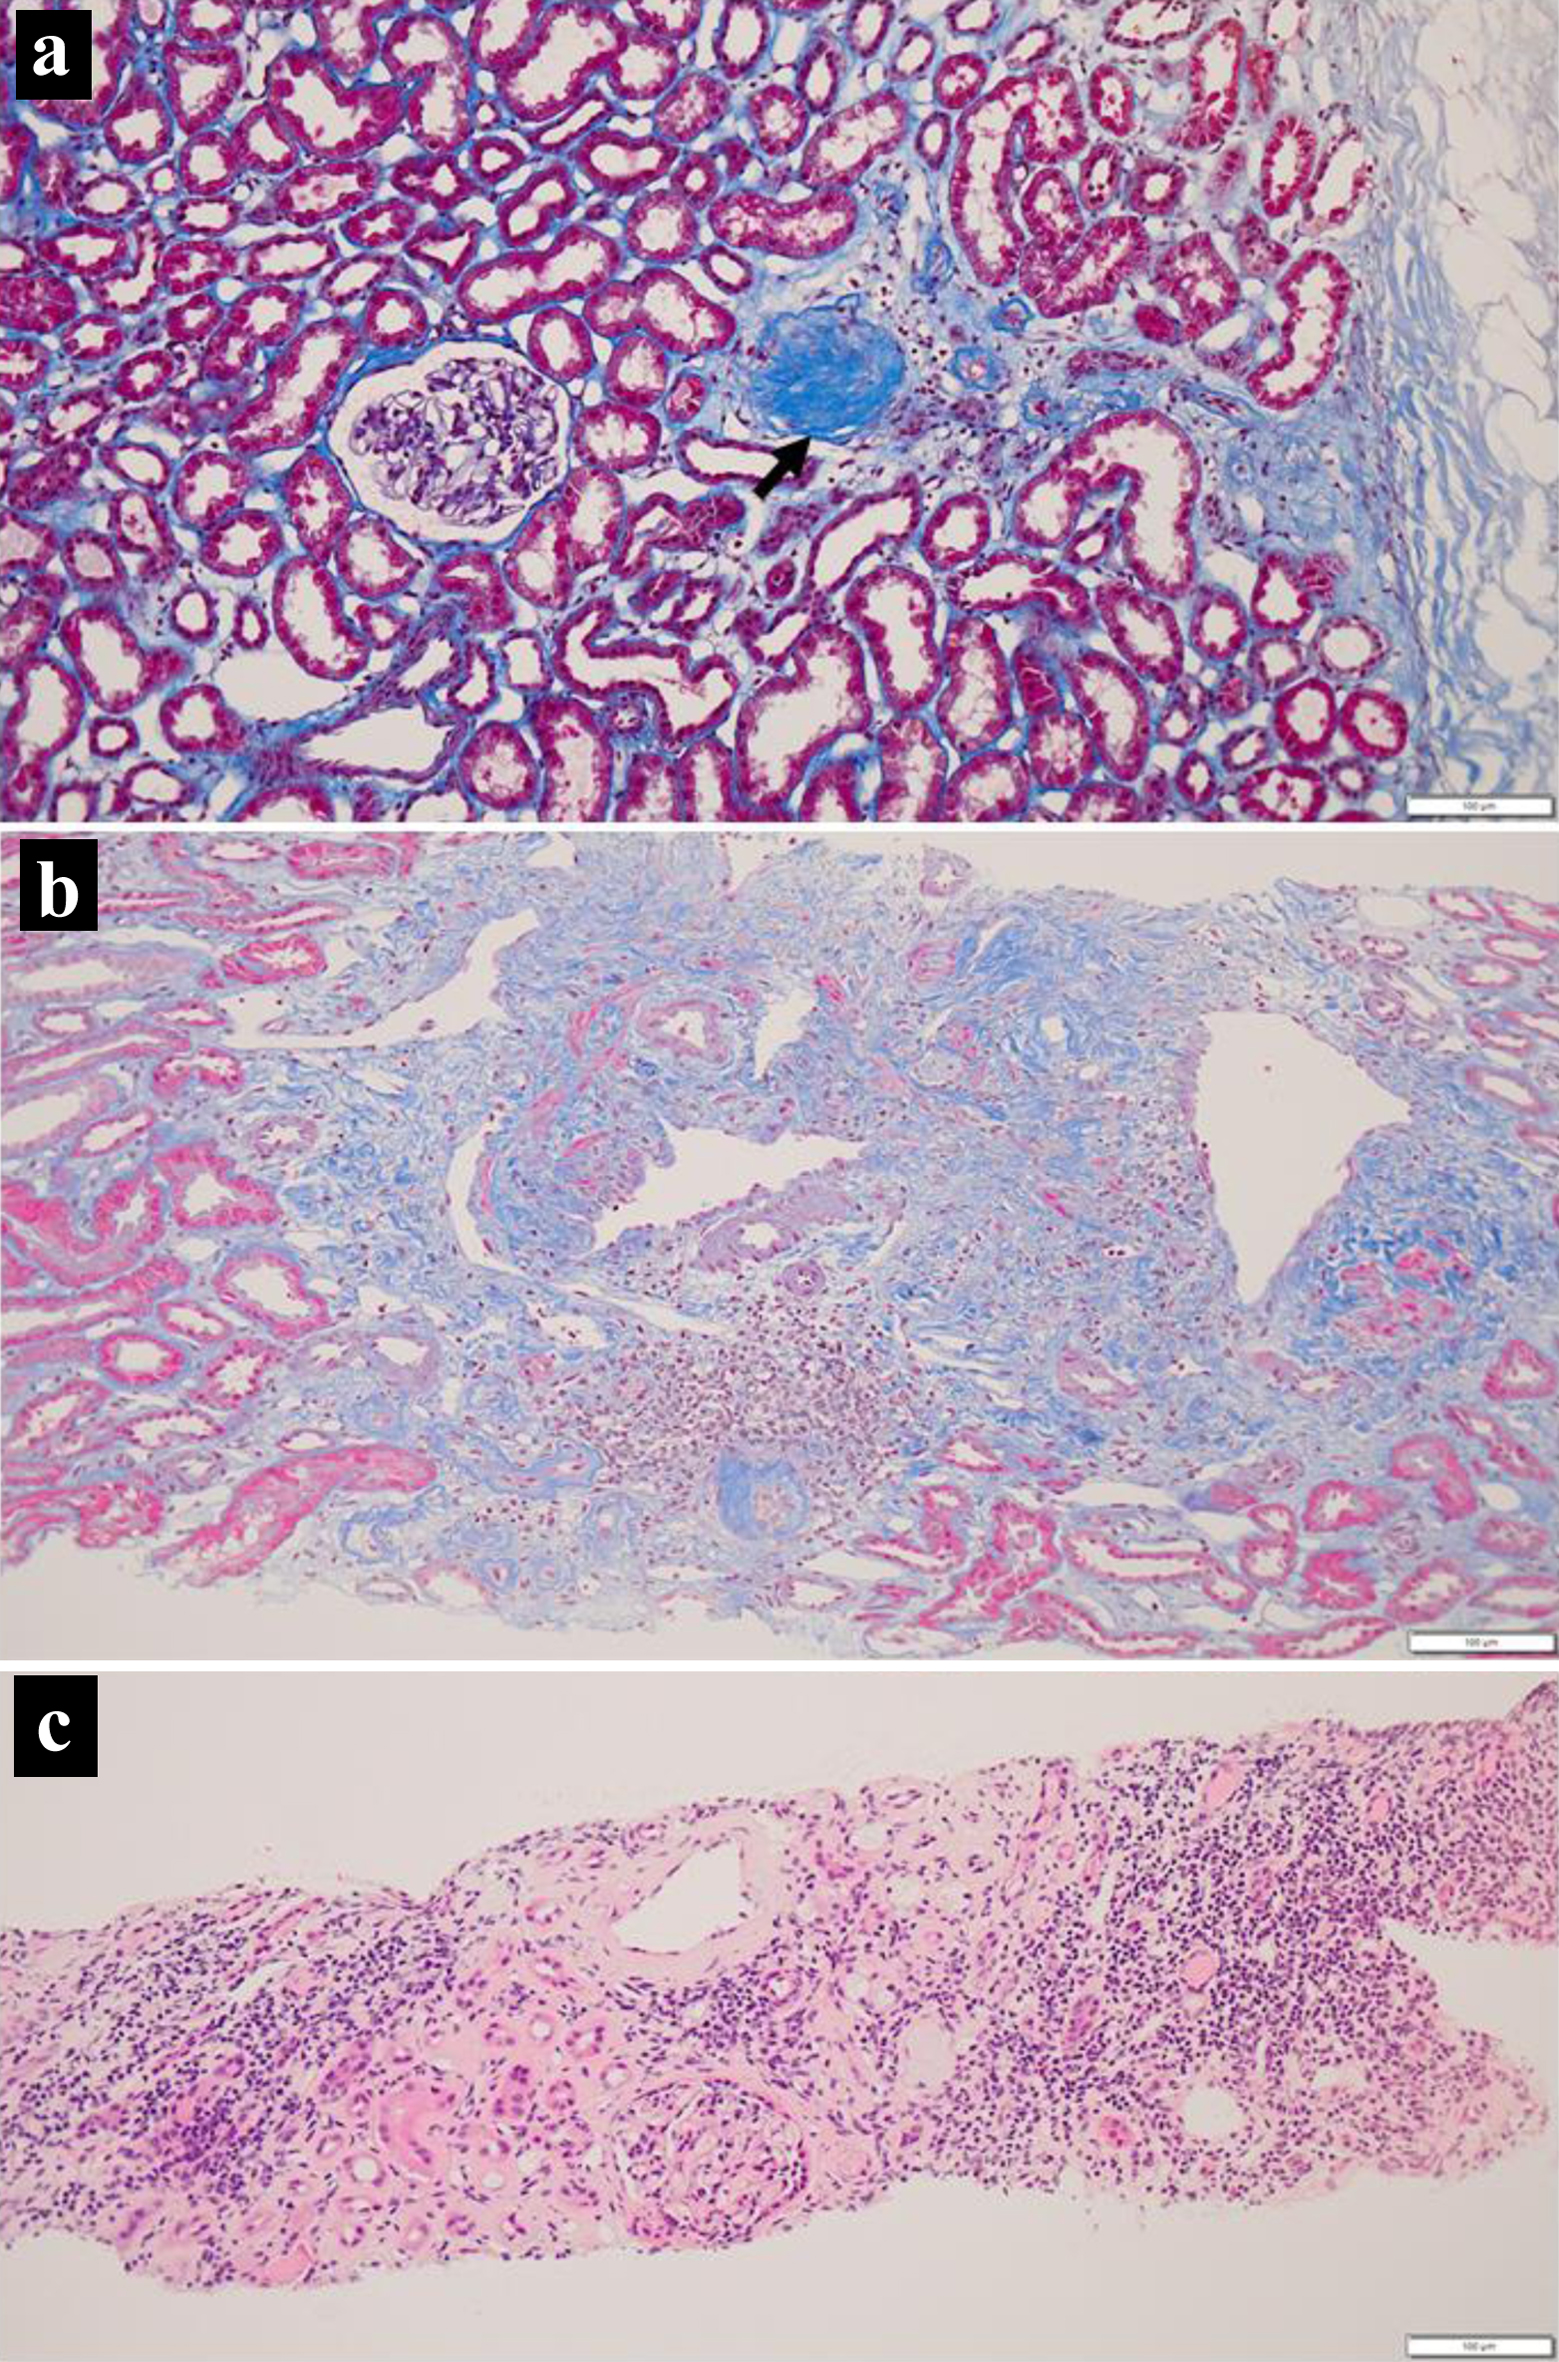
↓ Figure 3. Kidney biopsy at surgery (a), 4 weeks
(b) and 14 months (c) after transplantation. Note one glomerulus with global sclerosis (arrow, a) and
interstitial fibrosis with lymphocytic infiltration. Also note more advanced interstitial fibrosis with
lymphocytic infiltration at 14 months (c). Masson trichrome stain in a and b, hematoxylin-eosin stain in
c. Scale bar = 100 µm.
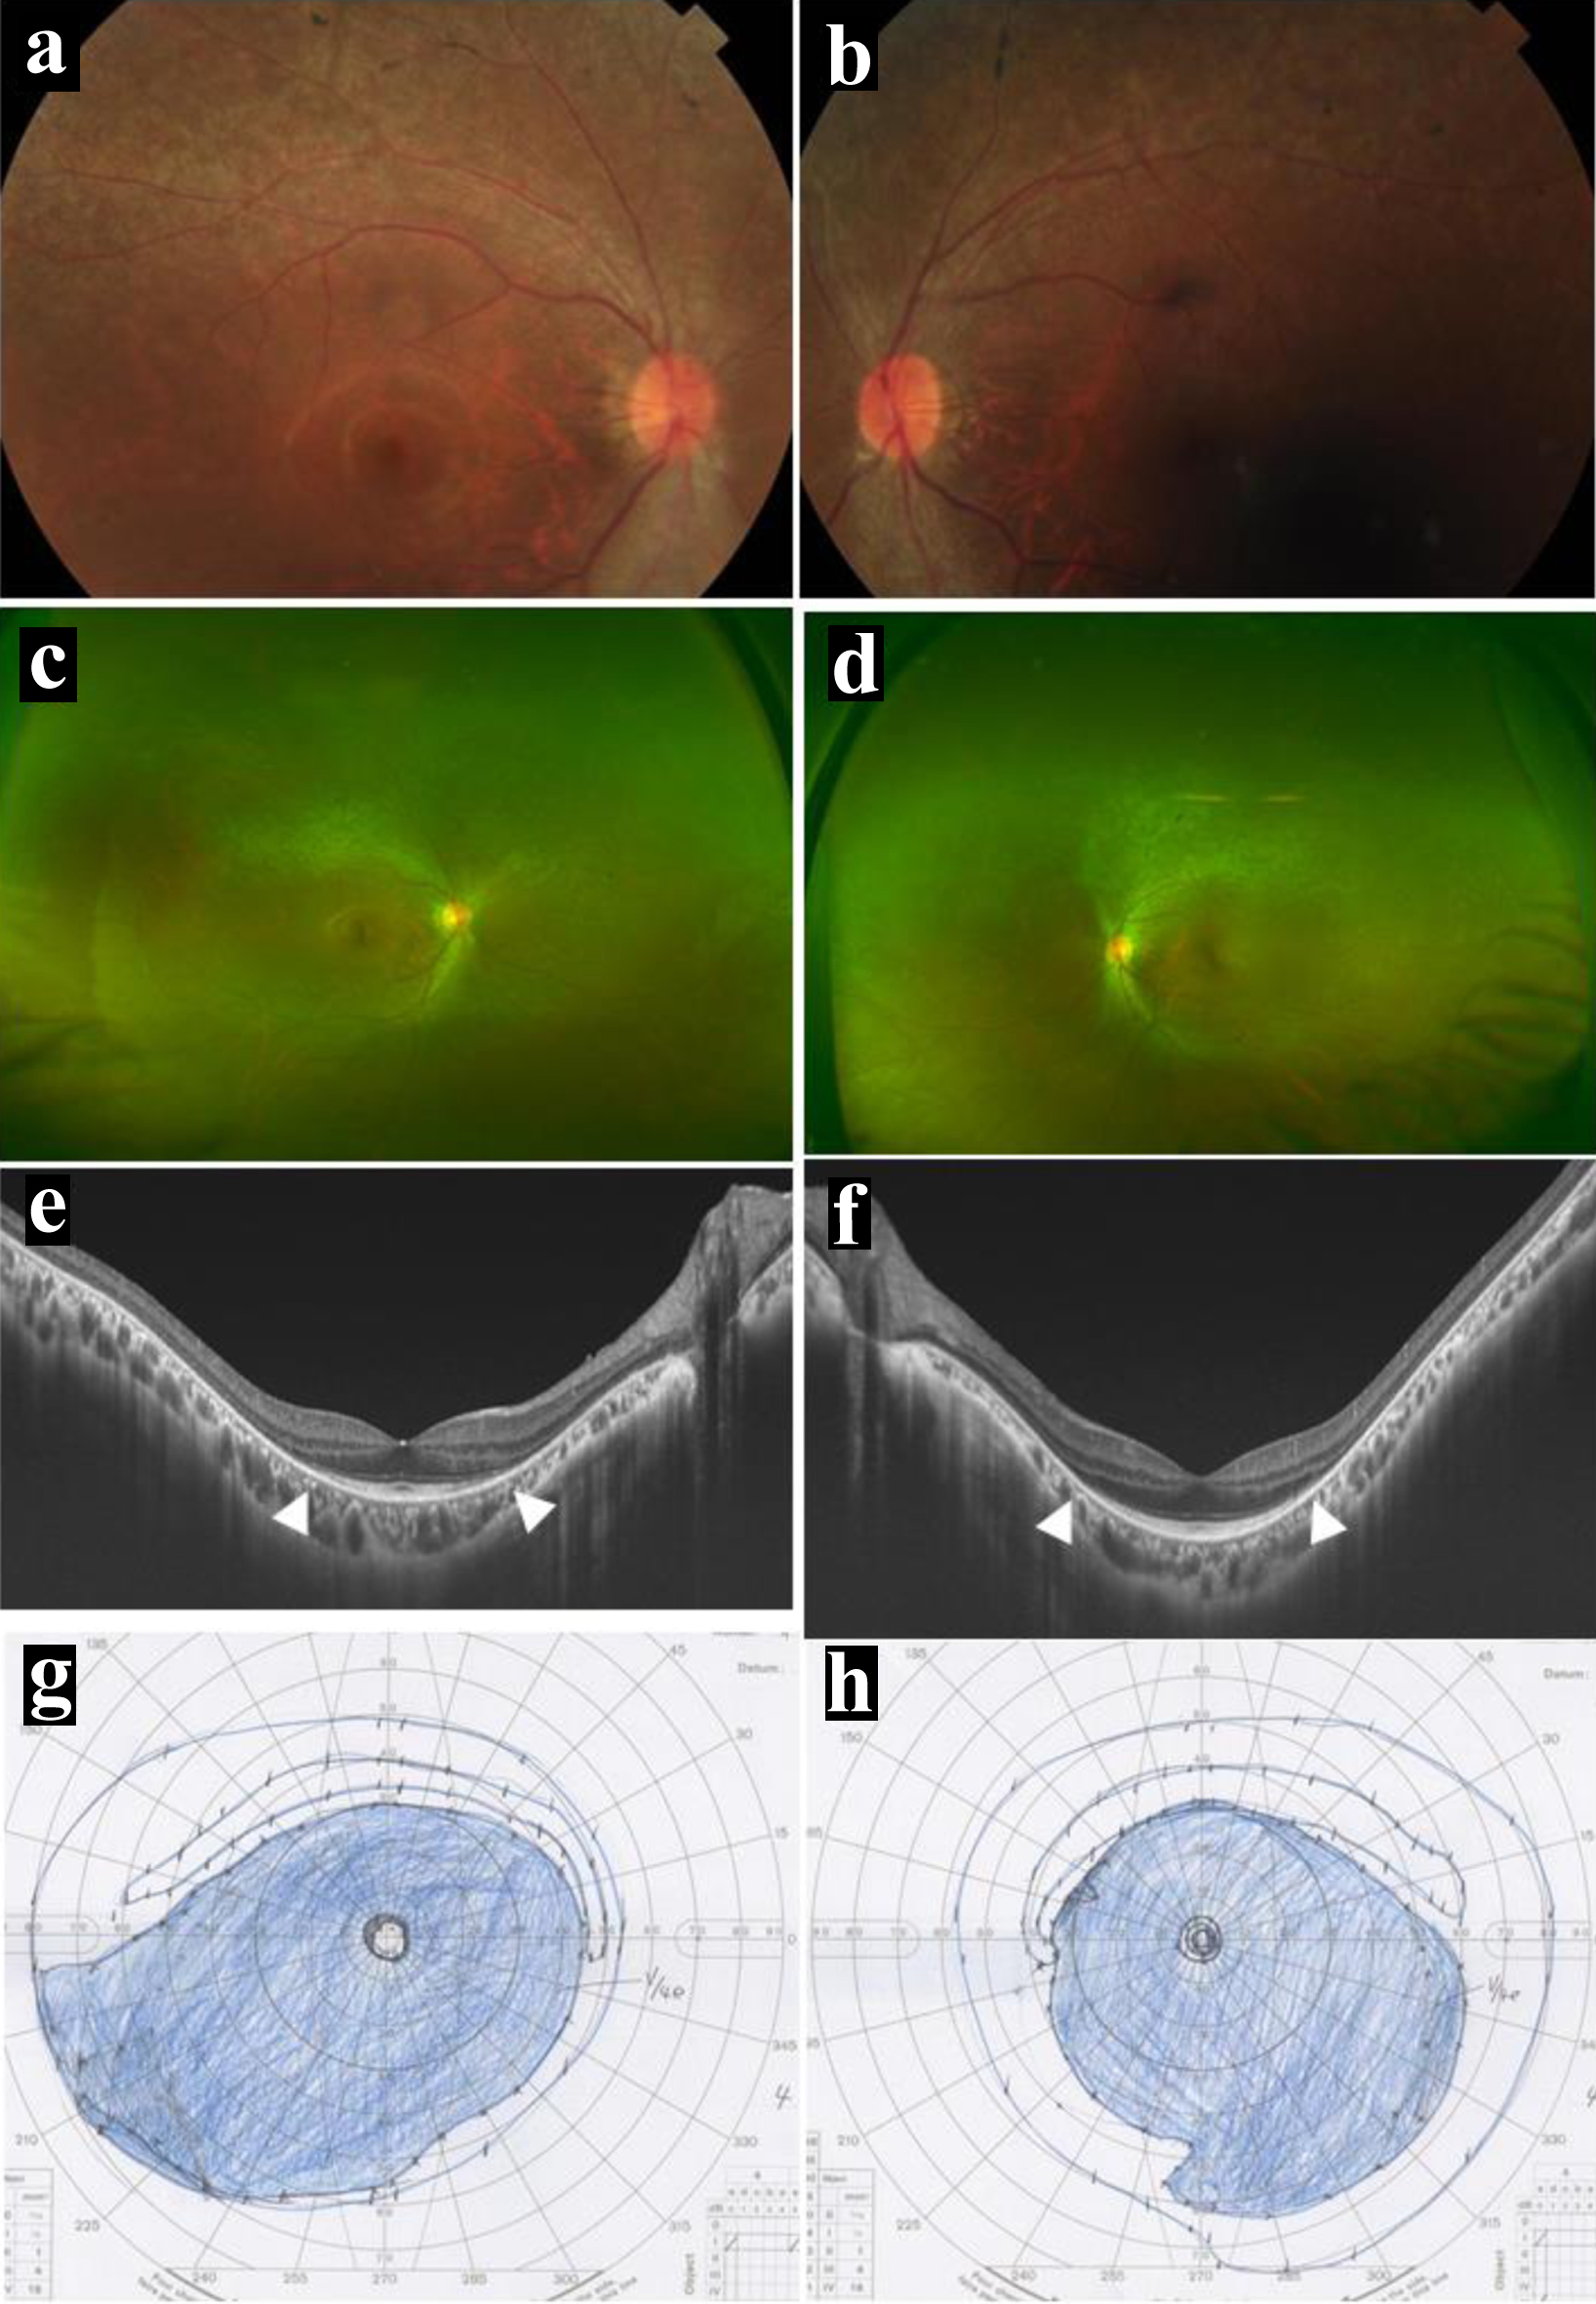
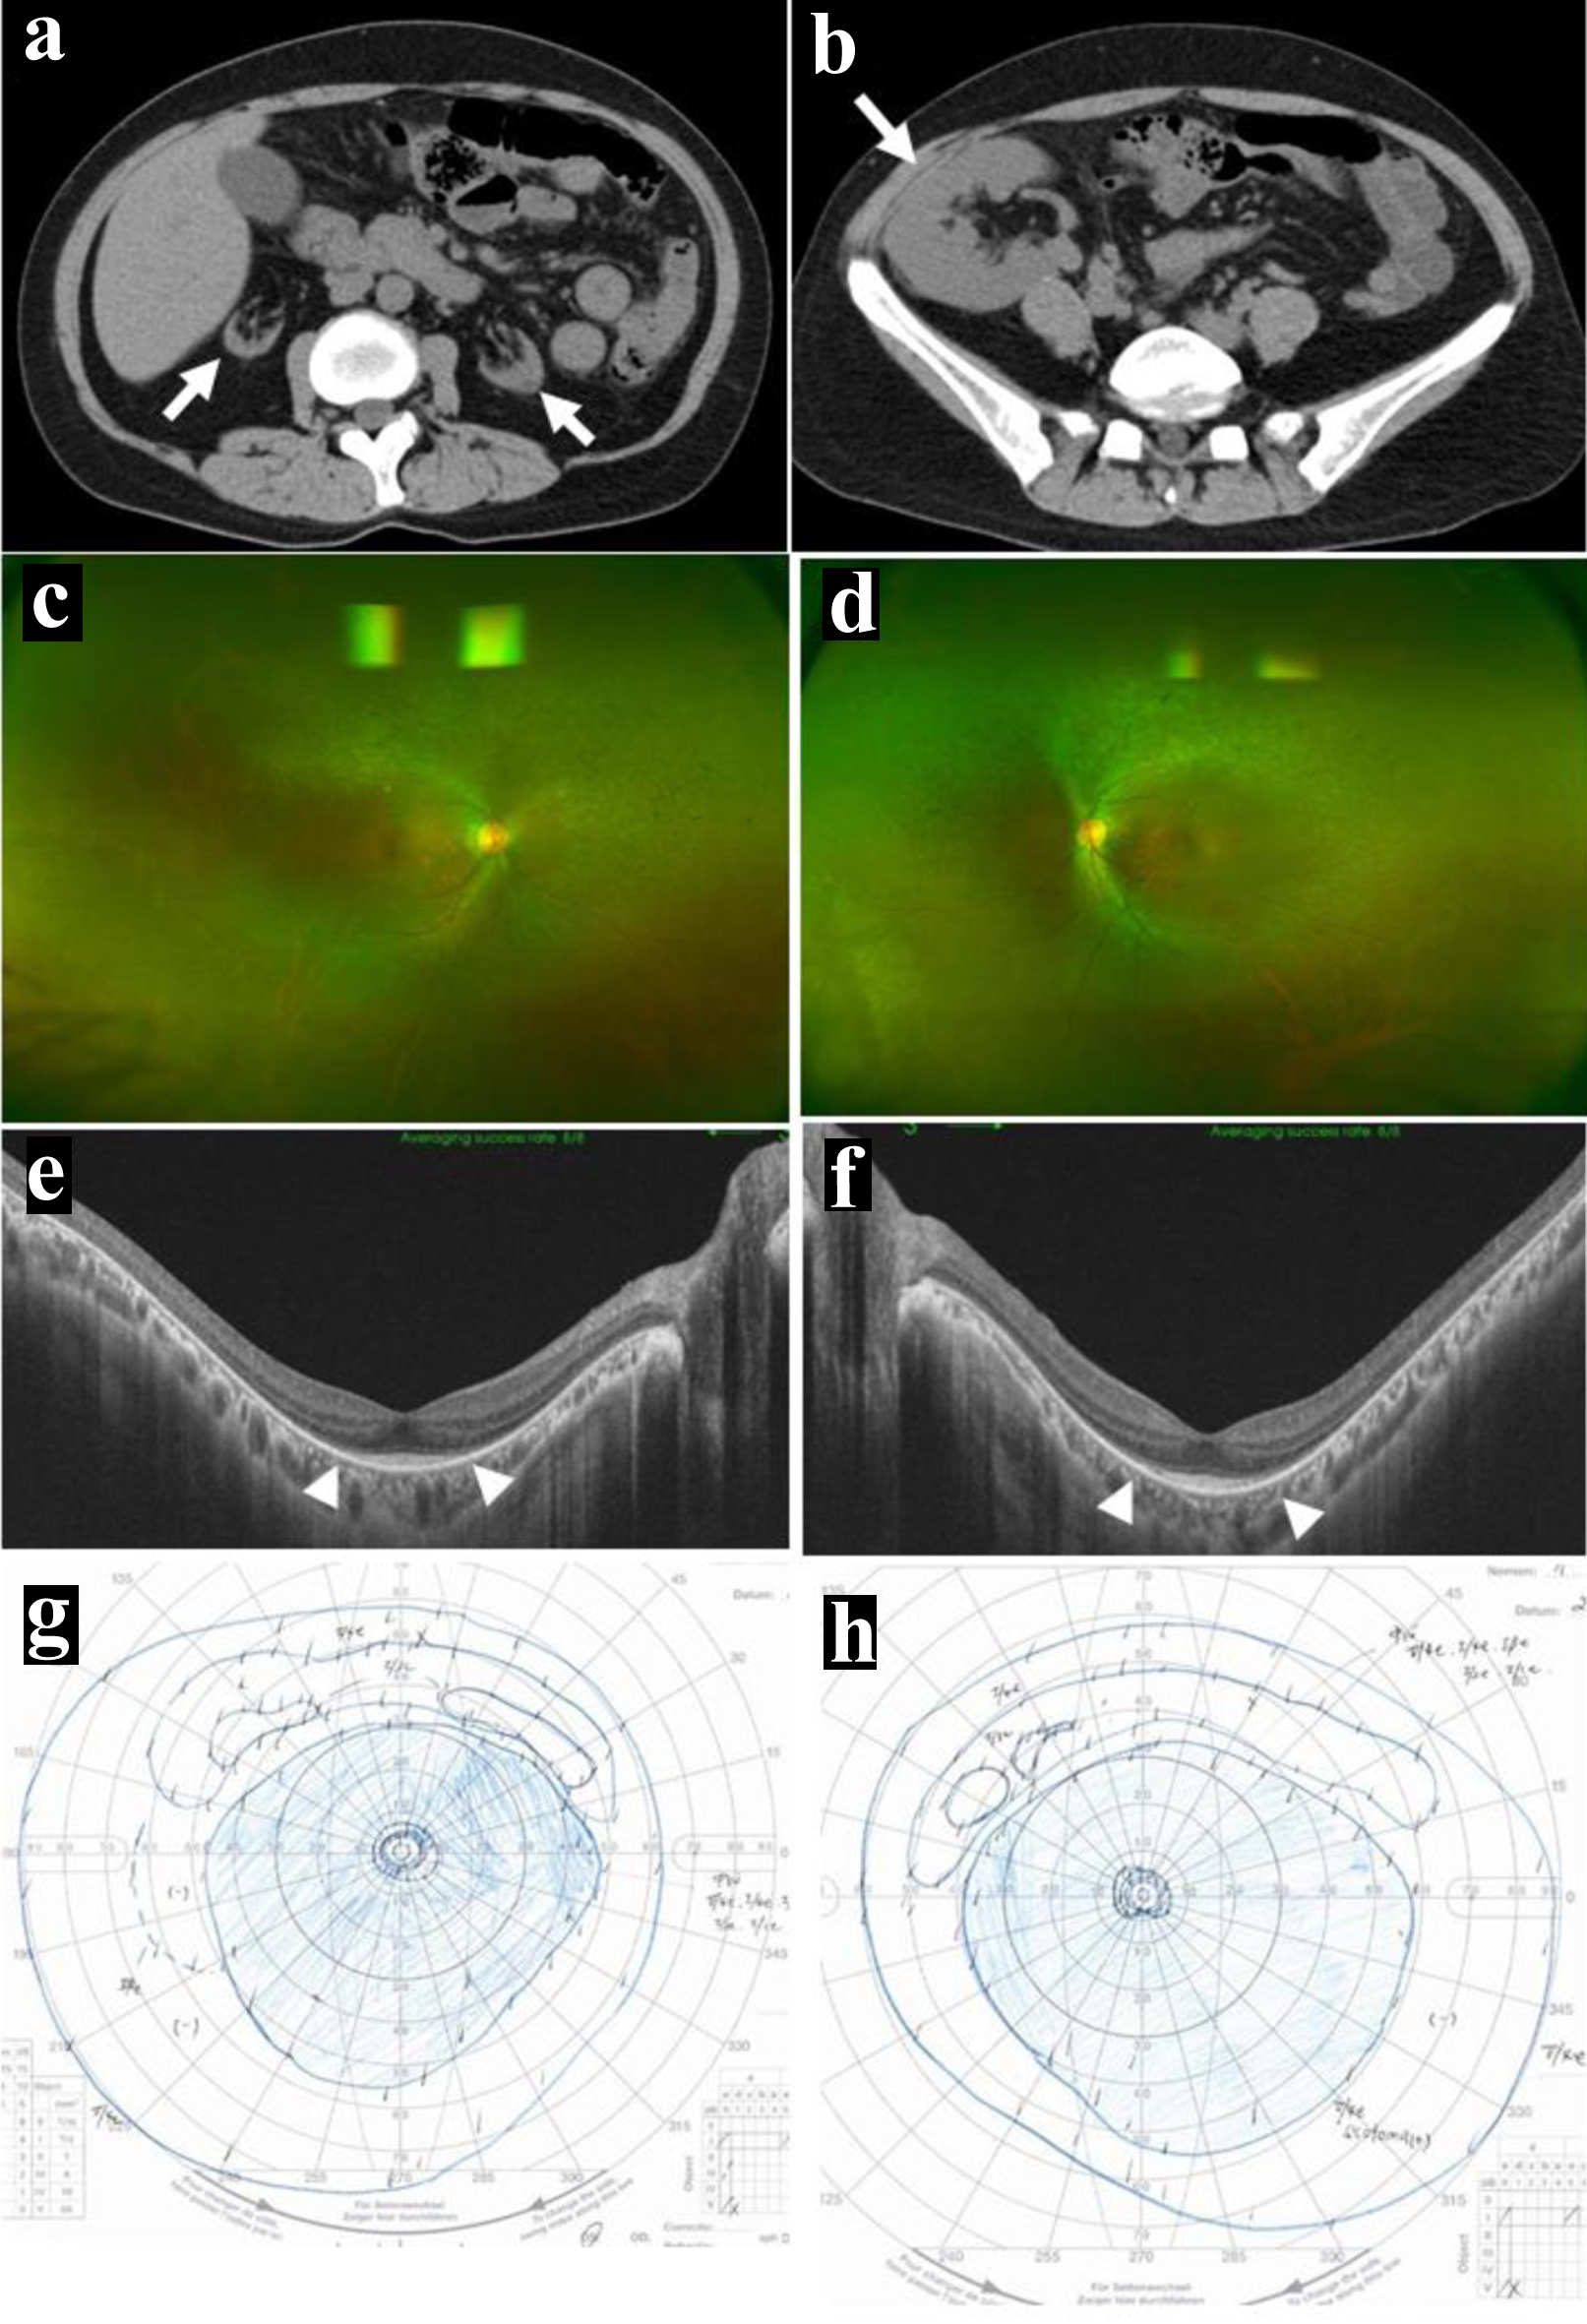
↓ Figure 4. Posterior pole (a in right eye, b in
left eye) and wide-field (c in right eye, d in left eye) fundus photographs, and horizontal section
images of optical coherence tomography (e in right eye, f in left eye) at the age of 23 years, 4 years
after kidney transplantation. Note mild diffuse non-pigmented retinal degeneration outside the vascular
arcade of the posterior pole (a-d) and the photoreceptor ellipsoid zones preserved only in the posterior
pole (between arrowheads, e and f). Visual fields by Goldmann perimetry (g in left eye, h in right eye),
showing concentric constriction to the central 5° meridians in both eyes, only with peripheral-rim
fields left behind.
↓ Figure 5. At the age of 31 years, 12 years
after kidney transplantation. Further atrophied kidneys (arrows, a) and kidney transplant in the normal
dimension (arrow, b). Wide-field fundus photographs (c in right eye, d in left eye) and horizontal
section images of optical coherence tomography (e in right eye, f in left eye), showing no change
compared with 8 years previously (Fig. 4a-f). Note mild diffuse non-pigmented retinal degeneration
outside the vascular arcade of the posterior pole (c, d) and the photoreceptor ellipsoid zones preserved
only in the posterior pole (between arrowheads, e and f). Visual fields by Goldmann perimetry (g in left
eye, h in right eye), showing concentric constriction to the central 5° meridians in both eyes,
only with peripheral-rim fields left behind.
Table
↓ Table 1. Blood Examinations at the Initial Visit and at the Latest
Visit, 12 Years Later
|
|
Normal range |
At
initial visit |
12
years later |
| ALP: alkaline phosphatase; ALT: alanine aminotransferase; AST: aspartate
aminotransferase; CK: creatine kinase; CRP: C-reactive protein; eGFR: estimated glomerular
filtration rate; γ-GT: γ-glutamyl transferase; HDL: high-density lipoprotein; LDH:
lactate dehydrogenase; LDL: low-density lipoprotein; n.d.: not determined. |
| Red blood cells (× 106/µL) |
3.86 - 4.92 |
3.43 |
4.31 |
| Platelets (× 103/µL) |
158 - 348 |
240 |
199 |
| White blood cells (× 103/µL) |
3.30 - 8.60 |
7.43 |
10.01 |
| Neutrophils (%) |
40.0 - 70.0 |
86.5 |
54.0 |
| Lymphocytes (%) |
16.5 - 49.5 |
10.7 |
39.7 |
| Monocytes (%) |
2.0 - 10.0 |
2.0 |
4.9 |
| Eosinophils (%) |
0.0 - 8.5 |
0.4 |
1.0 |
| Basophils (%) |
0.0 - 2.5 |
0.5 |
0.4 |
| Hemoglobin (g/dL) |
11.6 - 14.8 |
10.6 |
12.8 |
| Hematocrit (%) |
35.1 - 44.4 |
32.0 |
40.1 |
| Total protein (g/dL) |
6.6 - 8.1 |
7.0 |
6.9 |
| Albumin (g/dL) |
4.1 - 5.1 |
4.6 |
4.0 |
| LDH (U/L) |
124 - 222 |
228 |
172 |
| ALP (U/L) |
110 - 360 |
192 |
142 |
| AST (U/L) |
13 - 30 |
15 |
14 |
| ALT (U/L) |
7 - 23 |
7 |
8 |
| γ-GT (U/L) |
9 - 32 |
13 |
16 |
| CK (U/L) |
41- 153 |
57 |
52 |
| Amylase (U/L) |
44 -132 |
167 |
76 |
| Total bilirubin (mg/dL) |
0.40 - 1.50 |
0.57 |
1.13 |
| Urea nitrogen (mg/dL) |
8.0 - 20.0 |
51.5 |
14.7 |
| Creatinine (mg/dL) |
0.46 - 0.79 |
5.14 |
0.94 |
| eGFR (mL/min/1.73 m2) |
60 or greater |
10.4 |
57.3 |
| Uric acid (mg/dL) |
2.6 - 5.5 |
9.0 |
4.8 |
| Triglyceride (mg/dL) |
30 - 117 |
81 |
150 |
| HDL-cholesterol (mg/dL) |
41 - 100 |
66 |
n.d. |
| LDL-cholesterol (mg/dL) |
65 - 163 |
98 |
126 |
| Postprandial blood glucose (mg/dL) |
< 140 |
113 |
105 |
| CRP (mg/dL) |
0.00 - 0.14 |
0.09 |
1.17 |
| Sodium |
138 - 145 |
142 |
141 |
| Potassium |
3.6 - 4.8 |
3.1 |
3.2 |
| Chloride |
101 - 108 |
105 |
104 |