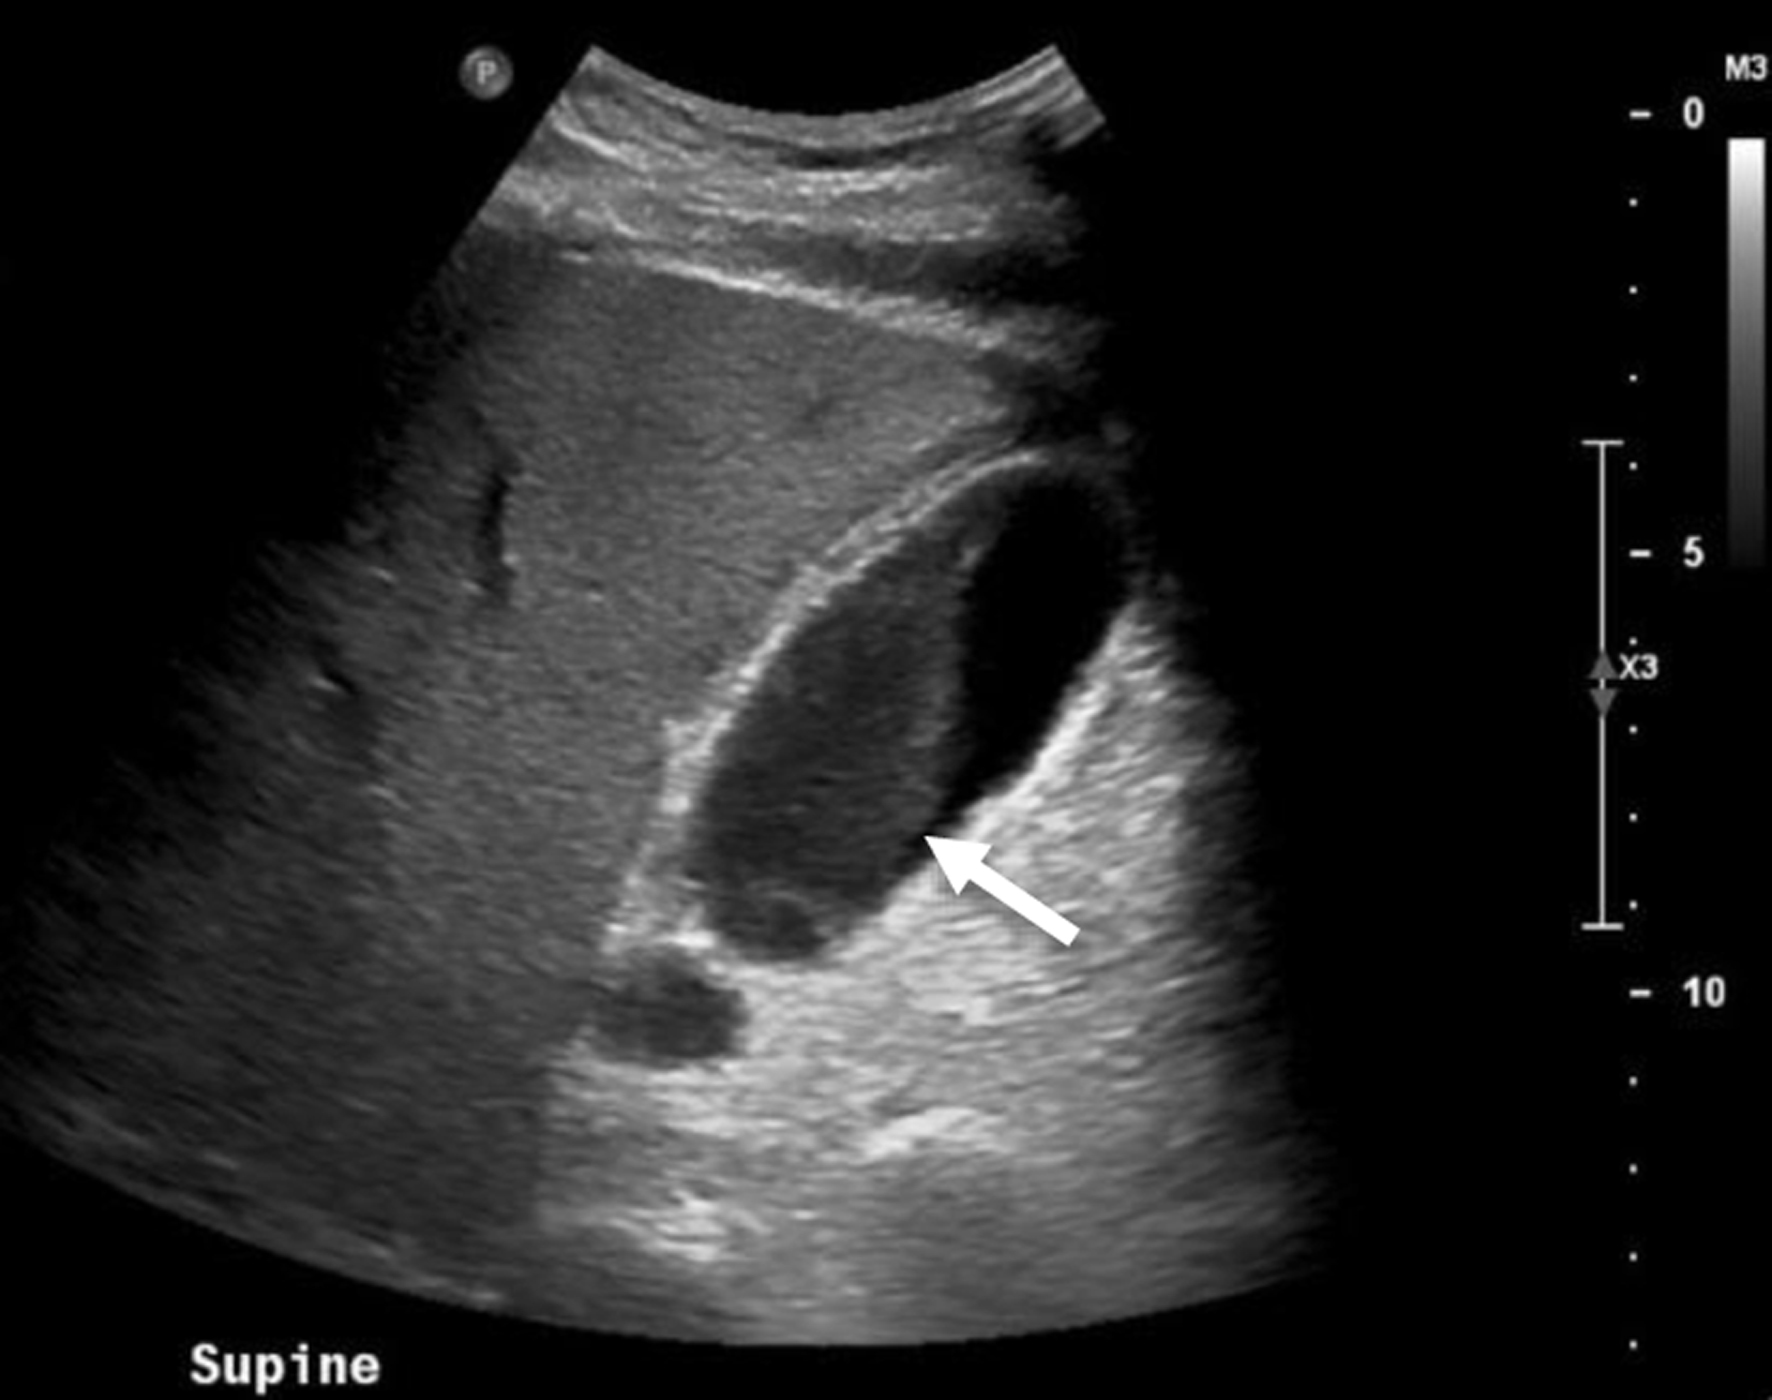
↓ Figure 1. Abdominal ultrasound of the patient
displaying thickened gallbladder wall (diameter 4.3 mm, normal < 3 mm) as well as sludge within the
gallbladder. Arrow points to sludge within gallbladder.
| Journal of Medical Cases, ISSN 1923-4155 print, 1923-4163 online, Open Access |
| Article copyright, the authors; Journal compilation copyright, J Med Cases and Elmer Press Inc |
| Journal website https://jmc.elmerpub.com |
Case Report
Volume 16, Number 12, December 2025, pages 504-509
Atypical Presentation of Gangrenous Cholecystitis in a Patient With Diabetes Mellitus
Figures
Table
| Lab values | Hospital day 0 | Hospital day 3/day of operation |
|---|---|---|
| White blood cell count (reference range 4,000 - 11,000 cells/mL) | 10.1 | 7.6 |
| Glucose (reference range 70 - 100 mg/dL) | 307 | 249 |
| Anion gap (reference range 4 - 12 mEq/L) | 19 | 18 |
| Aspartate aminotransferase (AST) (reference range 8 - 33 U/L) | 28 | 25 |
| Alanine transaminase (ALT) (reference range 4 - 36 U/L) | 25 | 22 |
| Total bilirubin (reference range 0.2 - 1.3 mg/dL) | 0.6 | 0.4 |